Position sizing on SOL: same 123 trades, 2.46x or 104.93x?
We replayed one EMA cross rule on SOL 4H through six sizing rules. The trade list never changed, yet final equity ran from 2.46x to 104.93x and the worst drawdown from -5.8% to -48.0%.
- Market
- SOLUSDT perpetual futures
- Timeframe
- 4H
- Data
- Sep 2020 – Nov 2026
- Sample
- 123 samples
Most of the time traders spend on a strategy goes into the entry. Which moving average, which lookback, which confirmation. Far less attention goes to the question that comes right after a signal prints: how much of the account goes into this trade. That second decision does not change whether you are right or wrong, but it changes almost everything about the result you actually live with.
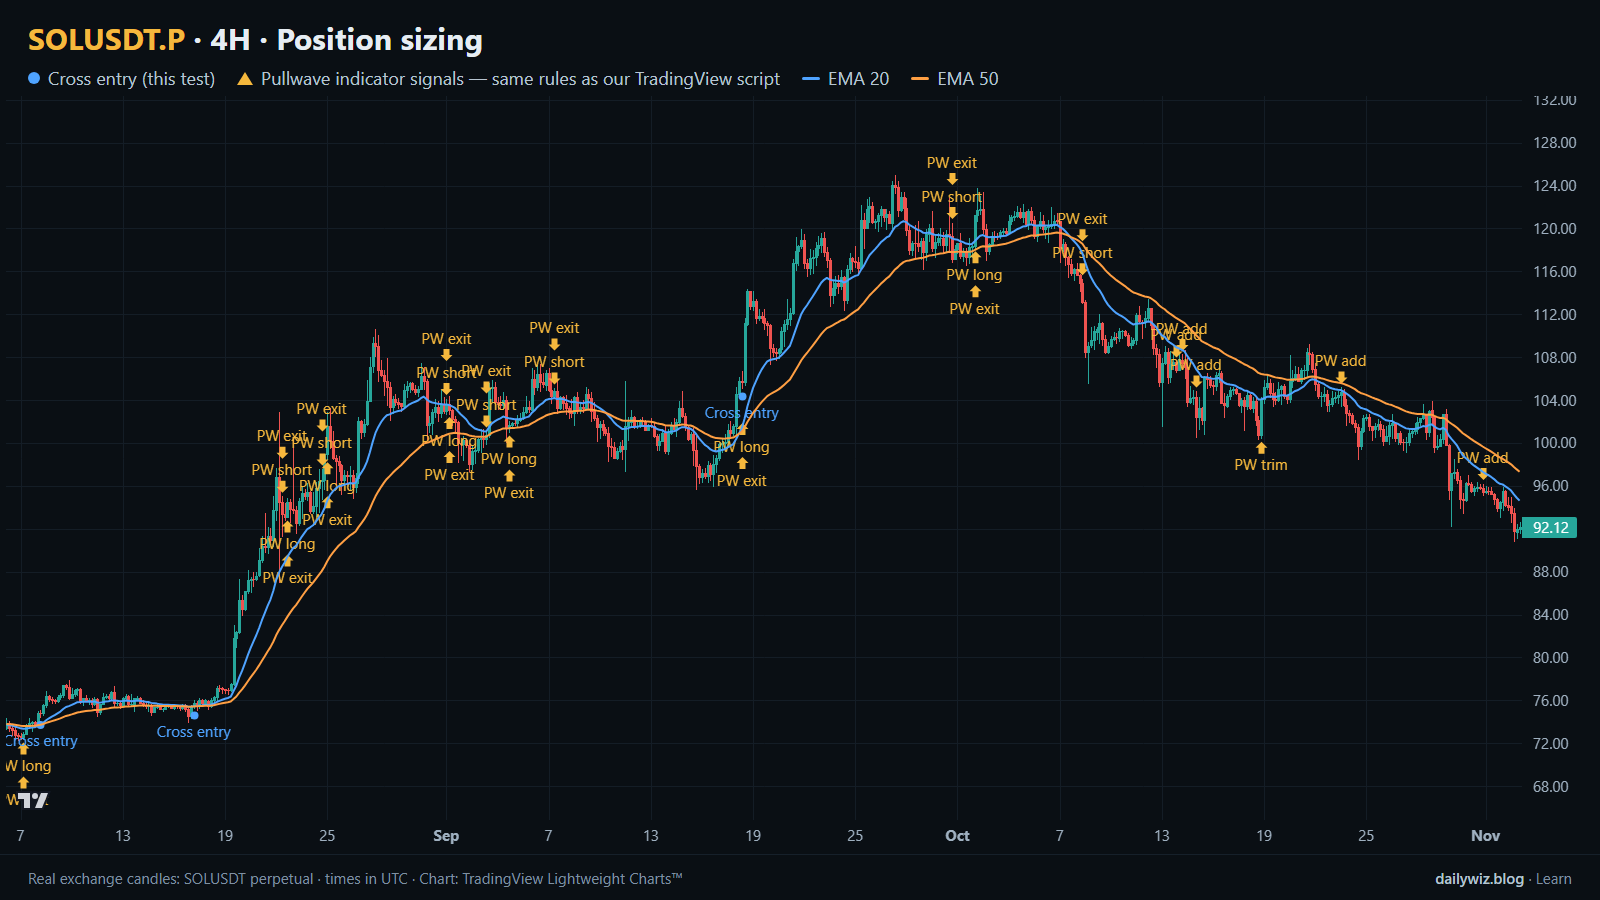
So we asked a narrow question we could answer with data: if the trade list is frozen — same entries, same exits, same costs — how far apart do the outcomes end up when only the position size changes? The chart above shows the entry side of that rule on SOL, with the blue dots marking cross entries and the EMA 20 and EMA 50 lines drawn on the price. Everything below is about what happens after those dots.
What Position sizing measures
Position sizing is the link between a signal and your balance. It answers one question: given this entry and this stop, how large is the position in terms of equity.
There are two families in common use. The first is fixed fractional sizing: every trade gets the same share of equity, for example 10% or 50% of the account, regardless of how far away the stop sits. It is simple, and the size of your loss depends entirely on how far price travels against you.
The second is risk-based sizing: you decide what fraction of equity you are willing to lose if the stop is hit — classically 1% or 2% — and then you work backwards. Divide the risk budget by the distance from entry to stop, expressed as a percentage, and you get the position size. A tight stop produces a large position, a wide stop a small one. The losses are meant to be even in size even though the stops are not.
Most traders read sizing through two numbers: the end result, and the worst peak-to-valley decline along the way. Those two tend to move together, and the interesting part is exactly how fast.
The test
We used Binance USDⓈ-M perpetual SOLUSDT candles on the 4H timeframe, from Sep 2020 to Nov 2026, 13445 bars in total. All timestamps are UTC.
The rule is deliberately plain and long-only: enter when the 20 EMA crosses above the 50 EMA, exit when it crosses back below or when price hits a stop 2 x ATR(14) below entry. Entries are taken at the close of the signal bar, exits at the close of the bar that triggers them, with a cost of 0.1% per trade. That produced 123 trades. Of those, 30.9% were winners, the average trade came to +8.35%, the longest run of consecutive losers was 11, and the median distance from entry to stop was 5.2%.
Because only one position is open at a time, the natural cooldown is the trade itself: no new entry can start before the previous one closes. Outcomes here are not measured a fixed number of bars after the signal; each trade runs from the close of the signal bar to the close of its exit bar.
The baseline in this study is not an "any bar" comparison, because the entries never change. The baseline is the trade list itself. We replayed those identical 123 trades through six sizing rules — fixed shares of equity, and risking 1% or 2% of equity to the stop, capped at 100% of equity, with no leverage — and recorded final equity and maximum drawdown for each. These figures were calculated on historical prices; they are not actual trades. The 0.1% cost is included; slippage, funding and any other execution friction are not.
Results
Same 123 trades, different position sizes (EMA 20/50 cross, 2 x ATR stop, 0.1% cost)
| Sizing rule | Median position size | Final equity | Max drawdown |
|---|---|---|---|
| 10% of equity per trade | 10% | 2.46x | -5.8% |
| 25% of equity per trade | 25% | 6.88x | -14.0% |
| 50% of equity per trade | 50% | 23.60x | -26.5% |
| 100% of equity per trade | 100% | 104.93x | -48.0% |
| Risk 1% of equity to the stop | 19% | 3.98x | -10.5% |
| Risk 2% of equity to the stop | 39% | 11.05x | -20.0% |
Calculated on historical prices; not actual trades. Fees and slippage not included.
The first thing to notice is that the win rate, the average trade and the losing streak are identical in every row. The rule was right exactly as often in all six cases. What separates 2.46x from 104.93x is nothing but the multiplier applied to each outcome.
The fixed-fraction rows move in one direction together. Going from 10% to 100% of equity per trade raises final equity from 2.46x to 104.93x, and it raises the worst drawdown from -5.8% to -48.0%. That is the honest shape of the trade-off: the compounding is not free, it is paid for in the depth of the holes along the way. A -48.0% drawdown means that at some point the account was worth roughly half of its previous peak, and the next entry still had to be taken on schedule for the rest of the curve to happen at all.
The risk-based rows are the more interesting part. Risking 1% of equity to the stop produced a median position of 19% — between the 10% and 25% fixed rows — and landed at 3.98x with a -10.5% drawdown. Risking 2% produced a median position of 39% and finished at 11.05x with -20.0%. Both sat close to the fixed-fraction rows of similar average size. With a median stop distance of 5.2%, the risk rule was mostly translating a fairly stable stop width into a fairly stable position, so it did not behave very differently from a fixed share. What it adds is not extra return but consistency: when a signal happens to come with an unusually wide stop, the position shrinks automatically.
Where it failed
The weakness in this test is structural rather than tied to a single week. With 30.9% winners and a longest losing streak of 11, the equity curve is made of long stretches of small bleeding punctuated by a few large winners. That shape is what produces the drawdown numbers in the table. At 100% of equity per trade, the string of losses that drove the -48.0% decline was not a disaster in the rule, it was the normal behavior of a low win rate strategy multiplied by the largest size allowed.
It is also worth saying what the table cannot show. A drawdown of -5.8% is easy to sit through; -48.0% is a different experience, and the main way sizing fails in practice is that the trader reduces size or stops taking entries somewhere inside the decline. The curve in the table assumes every one of the 123 trades was taken, in order, at full size.
How to read it on your chart
Before trusting any single cross, check the context the chart above makes visible: whether the EMA 20 and EMA 50 are separating or tangled, and how many entries the rule has handed you recently. Only a few blue dots appear in a window of this length, and a rule that fires this rarely means every individual trade carries weight.
If you use sizing rules like these, consider deciding the number before the signal, not after. The practical check is simple: look at the distance from your entry to the stop, ask what fraction of equity you lose if that distance is covered, and compare that with the worst streak you are willing to sit through. The test suggests the sizing choice invalidates itself when the drawdown it implies is larger than your tolerance, because the sequence only works if you are still trading at the end of it.
How the Pullwave indicator approaches this
The gold arrows on the chart above are marks from Pullwave, an invite-only TradingView indicator, drawn on the same candles as the blue dots of the tested rule. They come from the public record on pullwave.net, produced by the same rules as the script. Pullwave is rule-based: fixed rules on price and volume, with no discretion involved. Its futures version is built around SOLUSDT perpetual futures. Its rules are not published, it does not predict the future, and it has losing trades.
The comparison worth making is structural, not numerical. On the chart, Pullwave marks long and short entries, add-ons, partial exits and exits, and it can send a TradingView alert when a mark prints; the user places any orders themselves. A single-condition trigger like the cross tested here is noisy on its own. A complete rule set also has to answer when to add, when to take partial profit and when to exit — which is, in the end, the same sizing question this article measured, asked at every stage of a trade rather than only at the entry.
Key takeaways
- The same 123 trades, with the same 30.9% win rate and the same +8.35% average trade, produced final equity between 2.46x and 104.93x purely through position size.
- Returns and drawdowns scaled together: 10% of equity per trade gave -5.8% maximum drawdown, 100% gave -48.0%.
- Risking 1% or 2% of equity to the stop produced median positions of 19% and 39%, landing between the fixed-fraction rows rather than beating them.
- With a median stop distance of 5.2%, risk-based sizing behaved much like fixed sizing here; its value is consistency when stop width varies, not extra return.
- If you use any of these rules, consider the longest losing streak of 11 as the real test: a sizing choice only works if you can keep taking entries through it.
The gold arrows on the chart are marks from the Pullwave indicator for TradingView. See how the Pullwave indicator works on pullwave.net.
Chart rendered with TradingView Lightweight Charts™ from real exchange candles. tradingview.com