BTC 1H Pullbacks to the 20 EMA: 48.6% Closed Higher a Day Later
We tested 469 uptrend pullbacks to the 20 EMA on BTC/USDT 1H candles. Four hours out the touch beat the baseline slightly; one day and three days out the small edge disappeared.
- Market
- BTC/USDT spot
- Timeframe
- 1H
- Data
- Nov 2022 – Nov 2026
- Sample
- 469 events
"Wait for the pullback" is one of the oldest pieces of advice in trading. The logic sounds solid: in an uptrend, price drifts away from its short moving average, then comes back to it, and buyers who missed the move get a second chance at a better price. The 20 EMA is the line most traders use for this on intraday charts, and the 200 EMA is the line they use to decide whether the trend deserves the benefit of the doubt at all.
The question we wanted to answer is narrow and testable: on BTC/USDT hourly candles, when price is in a clean uptrend and dips back to touch the 20 EMA, what actually happens over the next few hours and days? Not what it feels like on a chart you already know the outcome of, but what the full record says across several years.
What Buying pullbacks to a moving average in an uptrend measures
An exponential moving average is a running average of closing prices that gives more weight to recent bars. A 20 EMA on an hourly chart tracks roughly the last day of trading and hugs price closely; a 200 EMA is much slower and is usually read as the dividing line between a market trading above its longer-term average and one trading below it.
The pullback idea combines the two. The slow line defines context: if price is above the 200 EMA and the 20 EMA is also above the 200 EMA, the structure is described as an uptrend. The fast line defines the trigger: a return of price to the 20 EMA after a stretch of trading above it. Traders read that touch as a pause inside a trend rather than a reversal, on the assumption that the same buyers who pushed price up will show up again near the average.
Common settings are 20 and 200 for the two EMAs, and the usual reading is that the first touches after a strong run matter more than the tenth touch inside a sideways drift. That is the assumption we put to the test.
The test
We used Binance BTC/USDT spot candles on the 1H timeframe, from Nov 2022 to Nov 2026, 35093 bars in total. All timestamps are UTC.
The rule was fixed in advance. An uptrend requires the close to be above the 200 EMA and the 20 EMA to be above the 200 EMA. An event is a bar whose low touches the 20 EMA after at least 5 consecutive closes above it. After an event, new events are ignored for 24 bars, so a single choppy stretch cannot flood the sample with near-duplicate signals. That cooldown left us with 469 events.
Outcomes were measured from the close of the signal bar to the close 4 hours, 1 day and 3 days later, with 1 day as the main horizon. We also tracked the deepest drawdown and the highest rise reached inside the main horizon, because the path matters as much as the destination. As a baseline we measured the same horizons starting from any bar in the dataset, which tells us what an uninformed start would have produced over the same period. These figures were calculated on historical prices; they are not actual trades. Fees and slippage are not included, and on a technique that produces hundreds of small-move events, costs would matter.
Results
What happened after the signal (uptrend pullback to the 20 EMA)
| After | Events | Closed higher | Median move | Middle half (25th / 75th pct) | Worst | Baseline: closed higher | Baseline: median |
|---|---|---|---|---|---|---|---|
| 4 hours | 469 | 53.5% | +0.05% | -0.3% / +0.4% | -4.2% | 50.9% | +0.01% |
| 1 day | 469 | 48.6% | -0.03% | -1.1% / +1.1% | -8.5% | 52.0% | +0.07% |
| 3 days | 469 | 49.9% | -0.00% | -1.9% / +2.2% | -11.7% | 52.5% | +0.18% |
Calculated on historical prices; not actual trades. Fees and slippage not included.
The short horizon is the only one that leans in favor of the technique. Four hours after the touch, 53.5% of events closed higher against a baseline of 50.9%, with a median of +0.05% against a baseline median of +0.01%. That is a tilt, not an edge you can build a plan around: the middle half of outcomes ran from -0.3% to +0.4%, which is inside the range of normal hourly noise.
Stretch the horizon and the tilt goes away. After 1 day, 48.6% of events closed higher while the baseline was 52.0%, and the median was -0.03% against a baseline median of +0.07%. After 3 days, 49.9% closed higher against a baseline of 52.5%. In other words, over the period we tested, starting a position at a 20 EMA touch did slightly worse than starting it at a random hour. The mean after 3 days was +0.40%, well above the median of -0.00%, which tells you the average is being carried by a small number of large winners rather than by consistent behavior.
The path figures fill in the picture. Within the main horizon, the median worst dip after an event was -1.15% and the median best rise was +1.25% — a near-symmetrical swing. Only 3.6% of events dipped more than 5%, so deep damage was rare, but shallow adverse movement was the norm rather than the exception.
By year (move after 1 day)
| Year | Events | Closed higher | Median move |
|---|---|---|---|
| 2022 | 12 | 41.7% | -0.30% |
| 2023 | 127 | 49.6% | -0.00% |
| 2024 | 123 | 50.4% | +0.02% |
| 2025 | 115 | 48.7% | -0.03% |
| 2026 | 92 | 45.7% | -0.19% |
Calculated on historical prices; not actual trades. Fees and slippage not included.
By year, the picture is flat rather than cyclical. 2024 was the only year above half at 50.4%, 2023 and 2025 sat just under, and 2026 was the weakest at 45.7% with a median of -0.19%. The 2022 row contains only 12 events and should not be read as a trend. Nothing here suggests the technique worked well in one regime and poorly in another; it was mediocre throughout.
Where it failed
The worst single event was 2025-03-03 06:00 UTC, which closed -8.5% lower one day later after dipping -10.0% along the way. The second worst was 2025-11-30 12:00 UTC at -6.6% with a dip of -7.3%, and the third was 2024-04-01 03:00 UTC at -5.5% with a dip of -6.5%. In each case the uptrend filter was satisfied at the moment of the touch — price was above the 200 EMA and the fast line was above the slow one — and the structure broke anyway within hours.
The best cases show the mirror image. 2023-10-23 13:00 UTC returned +12.5% with a worst dip of only -0.1%, and 2024-11-10 20:00 UTC returned +10.1% with a dip of -0.6%. Both touches happened at the start of strong directional expansions, and both barely traded against the signal. The lesson is that the big winners did not look different at the moment of the touch; they looked different afterwards.
The recent cluster is instructive too. Between 2026-10-05 04:00 UTC and 2026-10-21 05:00 UTC the rule fired four times, returning +0.1%, -4.1%, -0.8% and +0.2%. Same condition, same market, four different outcomes.
How to read it on your chart
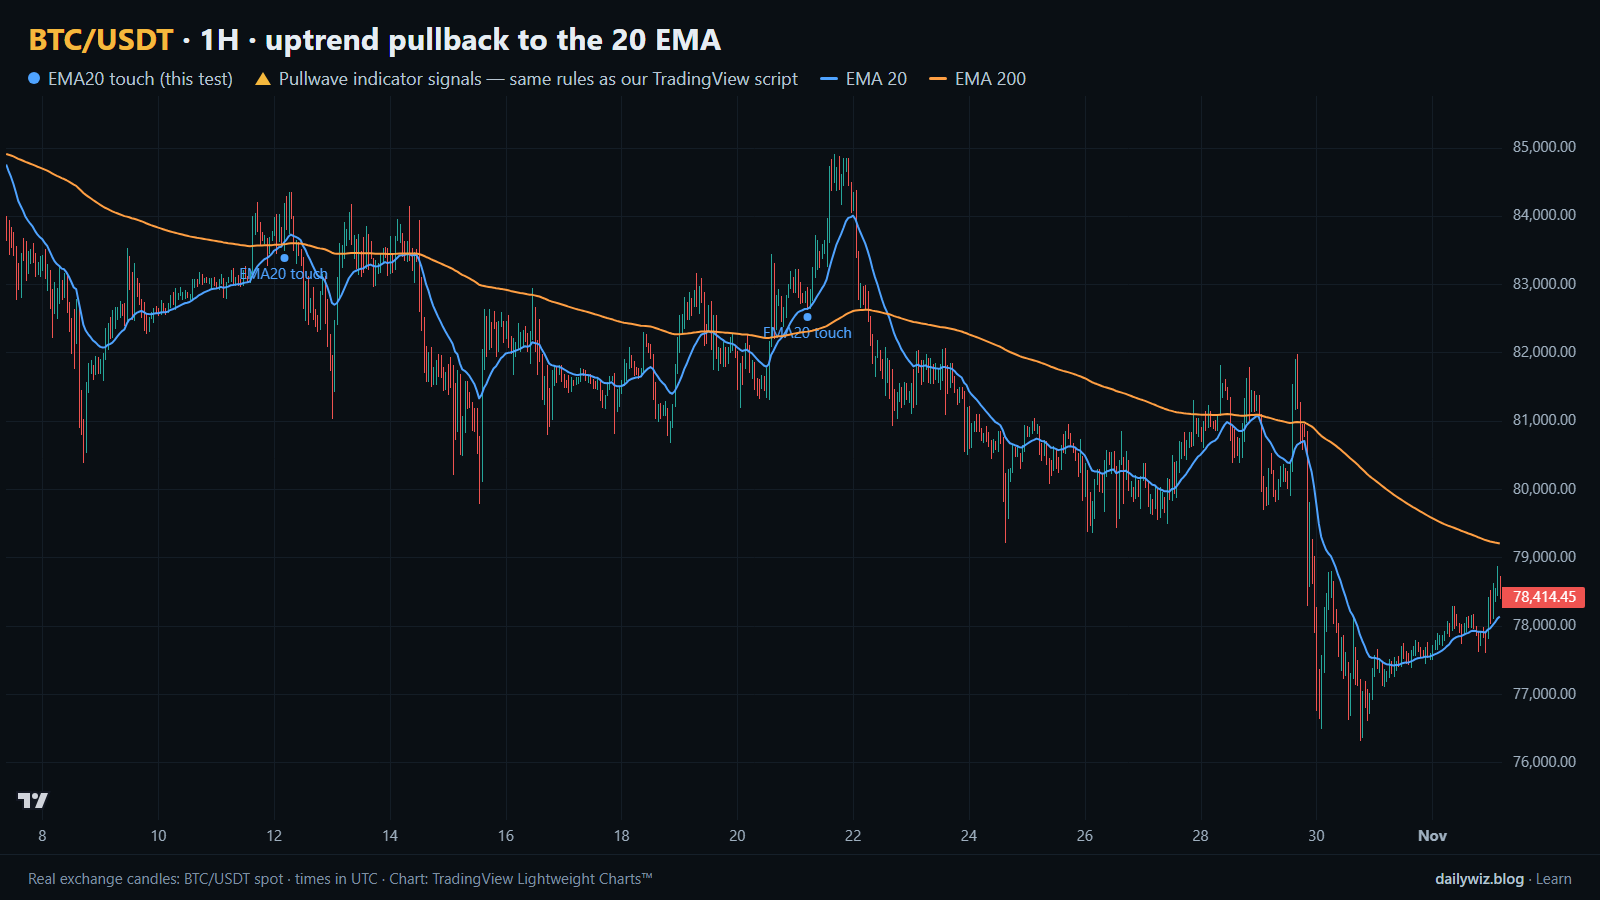
On the chart above, the blue dots mark each 20 EMA touch that satisfied the rule, with the EMA 20 and EMA 200 drawn over the candles. Two dots appear in this window, which is a realistic frequency: the cooldown of 24 bars keeps the signal rare enough to inspect by hand.
If you use this condition, the test suggests treating it as context, not as a trigger. Before trusting a touch, consider checking whether the preceding run was a genuine expansion or a slow drift, whether the 200 EMA is rising or flattening, and whether the touch is the first one in a move or the fourth in a range. A signal is reasonably treated as invalidated when price closes well below the fast average and the slow average turns, because at that point the uptrend premise that justified the entry no longer holds.
The path numbers also argue for planning the adverse side first. A median worst dip of -1.15% inside a single day means that even outcomes that ended positive usually traded against the signal first, so a stop placed too tight would have been hit by ordinary noise. And because the short horizon was the only one with any tilt, holding longer did not improve the statistics in our sample.
How the Pullwave indicator approaches this
Pullwave is an invite-only TradingView indicator. It is rule-based: fixed rules on price and volume, with no discretion. On a chart it marks long and short entries, add-ons, partial exits and exits, and it can send a TradingView alert when a mark prints. Its rules are not published, it does not predict the future, and it has losing trades. The futures version is built around SOLUSDT perpetual futures, while the spot version runs on major coins. The user places any orders themselves; the indicator only draws marks and sends alerts.
On the chart above, the gold arrows are Pullwave's marks on the same candles, taken from its public record, and in this window none appear — a useful contrast with the blue dots of the tested condition. That contrast is the general point a reader can take away: a single-condition trigger like the one tested here is noisy on its own, while a complete rule set also has to answer when to add, when to take partial profit and when to exit.
Key takeaways
- Across 469 events on BTC/USDT 1H, the 20 EMA touch in an uptrend beat the baseline only at the 4 hours horizon, 53.5% against 50.9%.
- At 1 day and 3 days the condition underperformed the baseline, with 48.6% and 49.9% closing higher against 52.0% and 52.5%.
- The mean after 3 days of +0.40% against a median of -0.00% shows the result depended on a few large winners, not on consistency.
- Median worst dip within the day was -1.15%, so adverse movement before any favorable movement was normal; only 3.6% of events dipped more than 5%.
- If you use this technique, consider it as a context filter combined with trend confirmation and a defined invalidation, rather than as a standalone entry.
The gold arrows on the chart are marks from the Pullwave indicator for TradingView. See how the Pullwave indicator works on pullwave.net.
Chart rendered with TradingView Lightweight Charts™ from real exchange candles. tradingview.com