Bullish RSI Divergence on SOLUSDT 4H: Does Price Really Turn Up?
We counted 64 bullish RSI divergences on SOLUSDT 4H candles from Sep 2020 to Nov 2026. Three days later only 44.4% closed higher, below the 50.0% baseline for any bar.
- Market
- SOLUSDT perpetual futures
- Timeframe
- 4H
- Data
- Sep 2020 – Nov 2026
- Sample
- 64 events
Bullish RSI divergence is one of the first patterns most traders learn. Price grinds down to a new low, the oscillator underneath refuses to follow, and the chart seems to whisper that sellers are running out of fuel. It is easy to teach, and on a printed chart it always seems to appear right before the bottom.
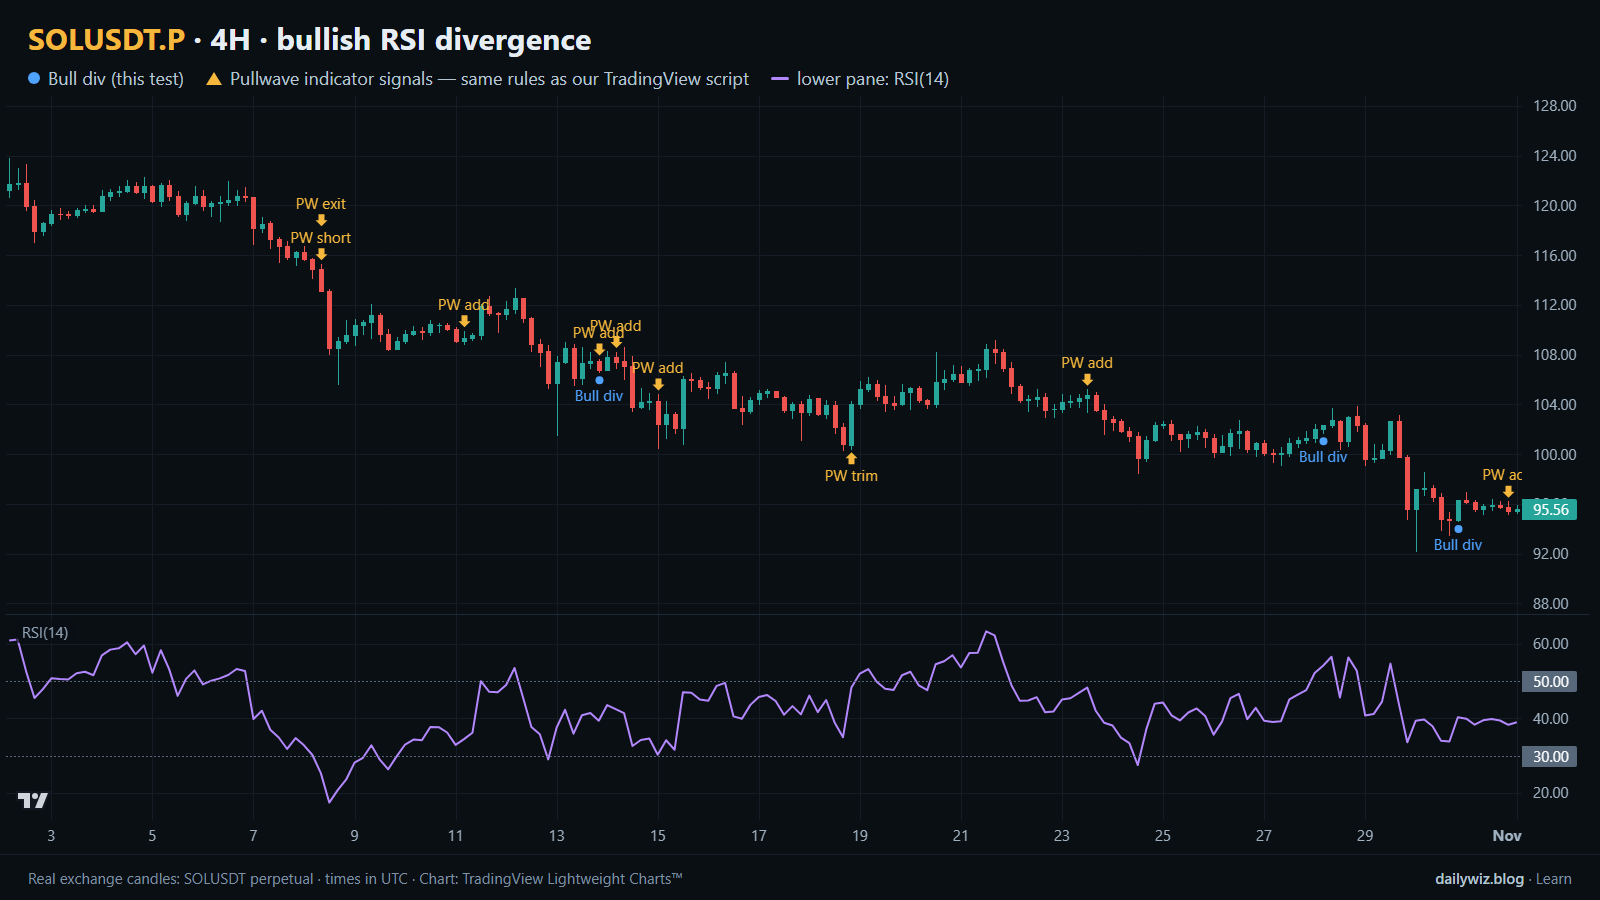
The question we care about is narrower: when SOL makes a lower low on the 4-hour chart while RSI makes a higher low, how often does price actually close higher afterwards, and is that better than picking a bar at random? Without a baseline, any pattern looks impressive in a market that spends years trending. On the chart above, blue dots mark the confirmed divergence events, the lower pane shows RSI(14), and the gold arrows are a separate reference we come back to at the end.
What Bullish RSI divergence measures
RSI compares the size of recent up closes with the size of recent down closes. With the standard setting of 14 bars, it averages the gains and the losses over those bars and converts the ratio into a value between 0 and 100. Readings near 70 are called overbought and readings near 30 oversold, though in a strong trend those labels mean little. The number simply describes how one-sided the last 14 bars have been.
Bullish divergence compares two swing lows in price with RSI at the same two points. Price makes its second low beneath the first; RSI makes its second low above the first. The reading is that the new low was produced with less downside force than the one before, so sellers are weakening. Traders usually want the pattern to form in a depressed RSI zone rather than mid-range, and they want the two lows reasonably close together.
The weak point is timing. Fading momentum is not a reversal. A market can print a divergence, drift sideways, then drop again, leaving the pattern technically valid and financially useless.
The test
We used Binance USDⓈ-M perpetual SOLUSDT candles on the 4H timeframe, from Sep 2020 to Nov 2026, which is 13433 bars. All timestamps are UTC.
The rule: two confirmed swing lows, where a swing low is a bar lower than the 5 bars on each side, at most 60 bars apart. The second low must be lower in price than the first but carry a higher RSI(14) reading, and RSI at that second low must be below 45, so the pattern forms in a genuinely weak part of the range. Because a swing low can only be confirmed once the bars to its right exist, the event is counted 5 bars after the second low. Everything the rule needs is already on the chart when the dot prints.
Outcomes were measured from the close of the signal bar to the close 1 day, 3 days and 7 days later, with 3 days as the main horizon. The baseline is any bar in the same period, measured the same way. A cooldown of 12 bars stops one long messy bottom from counting as a cluster. That left 64 events; longer horizons have slightly fewer because the newest signals lack a full window. These figures were calculated on historical prices; they are not actual trades. Fees and slippage are not included, which matters when the differences are small.
Results
What happened after the signal (bullish RSI divergence)
| After | Events | Closed higher | Median move | Middle half (25th / 75th pct) | Worst | Baseline: closed higher | Baseline: median |
|---|---|---|---|---|---|---|---|
| 1 day | 64 | 43.8% | -0.84% | -2.8% / +2.8% | -13.0% | 49.5% | -0.04% |
| 3 days | 63 | 44.4% | -1.87% | -5.0% / +5.6% | -17.6% | 50.0% | +0.01% |
| 7 days | 62 | 45.2% | -0.67% | -7.6% / +6.8% | -25.6% | 50.2% | +0.05% |
Calculated on historical prices; not actual trades. Fees and slippage not included.
The honest reading is that the pattern did not do what it is supposed to do. After 3 days, 44.4% of events closed higher against a baseline of 50.0%, with a median move of -1.87% against a baseline median of +0.01%. After 1 day it was 43.8% versus 49.5%; after 7 days, 45.2% versus 50.2%. In every window the divergence set closed higher less often than a randomly chosen bar.
The mean and the median disagree, and that gap is the interesting part. At 3 days the mean is +0.60% while the median is -1.87%; at 7 days the mean is +2.41% while the median is -0.67%. A handful of very large winners, such as the +56.6% best case at 3 days and the +92.8% best case at 7 days, pull the average up while most outcomes sit below zero. A pattern that is wrong more often than not can still show a positive average if the rare right calls are enormous.
The path was rough too. Within the 3-day window the median worst dip was -6.20%, and 57.8% of events dipped more than 5% before the window closed. The median best rise inside the same window was +5.26%. The typical signal offered a bounce and a drawdown of similar size, and the drawdown usually arrived.
By year (move after 3 days)
| Year | Events | Closed higher | Median move |
|---|---|---|---|
| 2020 | 3 | 66.7% | +16.08% |
| 2021 | 7 | 57.1% | +0.53% |
| 2022 | 17 | 23.5% | -3.02% |
| 2023 | 9 | 66.7% | +6.12% |
| 2024 | 10 | 50.0% | -0.86% |
| 2025 | 8 | 37.5% | -1.93% |
| 2026 | 9 | 44.4% | -0.04% |
Calculated on historical prices; not actual trades. Fees and slippage not included.
The year table shows how unevenly those results are spread. 2022 produced 17 events, the largest cluster, and only 23.5% closed higher with a median of -3.02%. That was the long downtrend, exactly when divergences print most often. By contrast 2023 produced 9 events with 66.7% closing higher and a median of +6.12%. Small yearly samples should not be over-read, but the direction is clear: the signal fired most in the market where it helped least.
Where it failed
The worst outcome came on 2022-01-05 00:00 UTC at 169.2, which closed -17.6% lower three days later after dipping -21.4%. Next was 2022-02-21 00:00 UTC at 93.79, down -17.4% with a -19.1% dip. Both sit inside the heavy risk-off phase of early 2022, when each oversold bounce was sold into and momentum improved only because the previous leg down had been so violent. The third, 2020-12-07 08:00 UTC at 1.83, lost -13.9% with an -18.0% dip in a thin, early-listing market.
The common thread is context, not pattern quality: all three were textbook divergences inside a dominant downtrend. Compare the best case, 2020-11-05 12:00 UTC at 1.43, up +56.6% with a worst dip of only -3.0%, and 2021-02-18 00:00 UTC at 8.48, up +20.7% with a -0.7% dip. The winners barely went against the signal at all.
How to read it on your chart
If you use this pattern, the test suggests treating it as context rather than as a trigger. Before trusting a blue dot, check what the higher timeframe is doing: the failures clustered in sustained downtrends, while the clean winners came when the market was already stabilizing. Check the spacing of the two lows as well; a divergence stretched across the maximum 60 bars describes a slower process than one formed over a few swings.
The chart above shows the most recent stretch. Two earlier events in 2026, on 2026-06-26 08:00 UTC at 68.58 and 2026-07-18 08:00 UTC at 74.91, closed +5.7% and +4.5% higher with dips of only -0.7% and -0.6%. Two later ones, 2026-10-13 20:00 UTC at 106.8 and 2026-10-28 04:00 UTC at 102.3, closed -2.2% and -6.6% with dips of -5.9% and -9.8%. Same pattern, opposite results.
A simple invalidation: if price closes below the second swing low, the structure the divergence was built on is gone. With 57.8% of events dipping more than 5%, any position sized as if the bounce were likely would have been uncomfortable.
How the Pullwave indicator approaches this
Pullwave is an invite-only TradingView indicator that follows fixed rules on price and volume, with no discretion. On the chart it marks long and short entries, add-ons, partial exits and exits, and it can send a TradingView alert when a mark prints. The futures version is built around SOLUSDT perpetual futures, and the spot version runs on major coins. Its rules are not published, it does not predict the future, and it has losing trades.
The gold arrows on the chart above are Pullwave's marks on the same candles, taken from the public record on its site, the same rules as the TradingView script. Compare them with the blue dots of the technique tested here. The general idea a reader can take away is that a single-condition trigger like this one is noisy on its own; a complete rule set also has to answer when to add, when to take partial profit and when to exit. The user places any orders themselves; the indicator only draws marks and sends alerts.
Key takeaways
- Across 64 events on SOLUSDT 4H from Sep 2020 to Nov 2026, bullish RSI divergence closed higher 44.4% of the time after 3 days, below the 50.0% baseline.
- The median outcome was negative at every horizon while the mean was positive at 3 and 7 days, so a few very large winners carried the average.
- The path was rough: median worst dip of -6.20% inside the 3-day window, with 57.8% of events dipping more than 5%.
- Context dominated. The 17 events of 2022 closed higher only 23.5% of the time; the 9 events of 2023 did so 66.7% of the time.
- If you use this pattern, consider it a reason to pay attention rather than a reason to act, and define in advance what would invalidate it.
The gold arrows on the chart are marks from the Pullwave indicator for TradingView. See how the Pullwave indicator works on pullwave.net.
Chart rendered with TradingView Lightweight Charts™ from real exchange candles. tradingview.com