ETHUSDT: Do Breakouts Above the 20-Day High Follow Through?
We counted 56 daily closes above the prior 20-day high on ETHUSDT perpetual futures. After 7 days, 51.8% closed higher against a 51.6% baseline, an edge too small to lean on alone.
- Market
- ETHUSDT perpetual futures
- Timeframe
- 1D
- Data
- Sep 2020 – Oct 2026
- Sample
- 56 events
A breakout is one of the oldest ideas in trading: when price pushes above the highest point of the recent past, something has changed, and the move is supposed to continue. The 20-day high is the classic version of that idea. It is simple, visible on any chart, and it feels right, because a market that takes out a month of resistance should have buyers behind it.
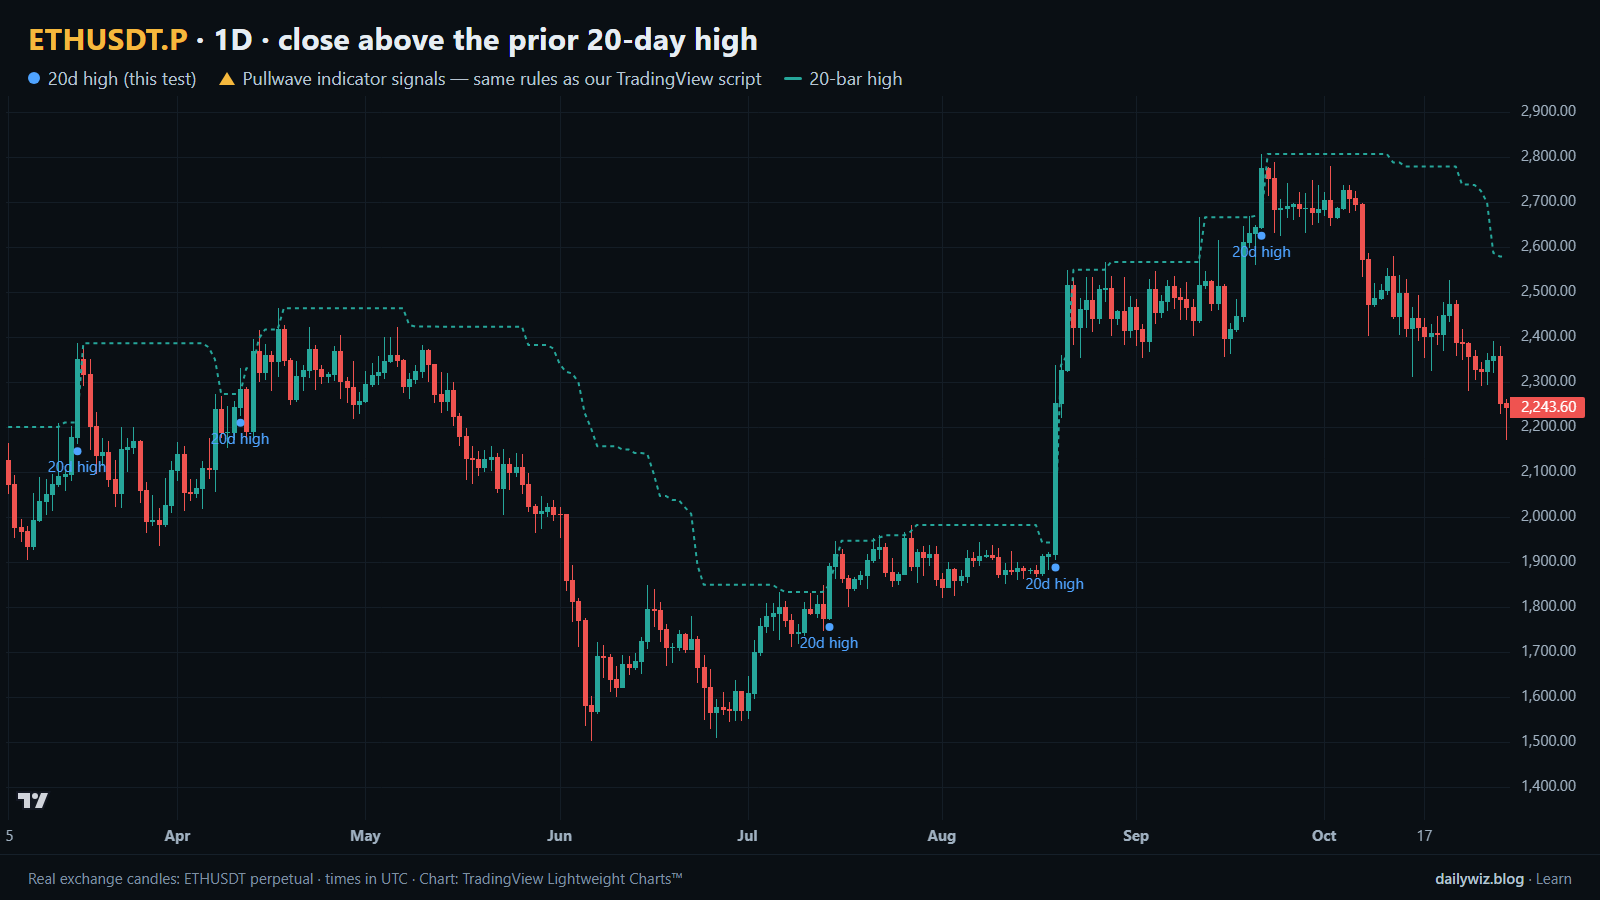
But feeling right and being right are different things. The question we wanted to answer is narrow and testable: when ETHUSDT closes above the highest high of the previous 20 days, is the following week usually better than an ordinary week? That is the only thing this article measures. The chart above shows the setup. Blue dots mark each breakout event, the line is the rolling 20-bar high, and the gold arrows are Pullwave's own marks on the same candles for comparison.
What Breakouts above a 20-day high measures
The calculation is plain. For every bar, look back at the previous 20 daily bars and find the highest high among them. If today's close finishes above that level, today is a breakout bar. If the close is at or below it, nothing happens. This is the upper band of what traders call a Donchian channel, named after Richard Donchian, who built trend systems around exactly this kind of rule.
Common lookbacks are 20 and 50 bars. Shorter lookbacks fire often and catch small swings; longer ones fire rarely and only on major expansions. On a daily chart, 20 bars is roughly a month of trading, which is why it is the default many traders reach for.
The usual reading is momentum: the breakout says every buyer from the last month is now in profit and nobody above is trapped. The usual criticism is just as old. In a range, the 20-day high is simply the top of the range, and the breakout is the moment a range trader fades. Both readings are plausible. The test exists to see which one the data supports for this market.
The test
We used Binance USDⓈ-M perpetual ETHUSDT candles on the 1D timeframe, from Sep 2020 to Oct 2026, which is 2251 bars. All timestamps are UTC.
The rule: a daily close above the highest high of the previous 20 days, after a close that was not above it. This isolates the moment of the break rather than counting every day inside an extended run. After an event, new events were ignored for 7 days, so a single trending leg cannot flood the sample with near-identical observations. That cooldown left 56 events.
Outcomes were measured from the close of the signal bar to the close 3, 7 and 30 bars later. The main horizon is 7 days. As a baseline we took every bar in the same period and measured the same forward windows, which tells us what an ordinary, unselected day looked like. If the breakout carries information, it should beat that baseline; if it does not, it is describing an average day with extra steps.
These figures were calculated on historical prices; they are not actual trades. No fees, funding or slippage are included, and real execution would subtract from every column below.
Results
What happened after the signal (close above the prior 20-day high)
| After | Events | Closed higher | Median move | Middle half (25th / 75th pct) | Worst | Baseline: closed higher | Baseline: median |
|---|---|---|---|---|---|---|---|
| 3 days | 56 | 50.0% | +0.57% | -3.5% / +5.9% | -11.7% | 52.3% | +0.23% |
| 7 days | 56 | 51.8% | +0.59% | -6.1% / +7.2% | -17.2% | 51.6% | +0.28% |
| 30 days | 56 | 53.6% | +0.83% | -8.2% / +15.4% | -41.4% | 53.0% | +1.29% |
Calculated on historical prices; not actual trades. Fees and slippage not included.
The honest summary is that the edge is very small. After 7 days, 51.8% of breakouts closed higher, against a baseline of 51.6%. After 3 days, the breakouts did worse than the baseline on hit rate: 50.0% versus 52.3%. Only at 30 days do the events lead slightly, 53.6% against 53.0%, and there the baseline median of +1.29% is larger than the event median of +0.83%.
The spread matters more than the center. At 7 days the middle half of outcomes ran from -6.1% to +7.2%, with a best of +21.8% and a worst of -17.2%. At 30 days the range widened to -8.2% and +15.4%, with a best of +61.5% and a worst of -41.4%. The mean at 30 days, +3.87%, sits far above the median of +0.83%, which is the signature of a few large winners carrying the average while the typical case does almost nothing.
The path was rough too. Within the 7-day window the median worst dip was -5.10%, and 50.0% of events dipped more than 5% at some point before the window closed. The median best rise within the same window was +5.89%. A typical breakout therefore offered a swing in both directions roughly the size of the whole expected move.
By year (move after 7 days)
| Year | Events | Closed higher | Median move |
|---|---|---|---|
| 2021 | 10 | 70.0% | +1.21% |
| 2022 | 7 | 42.9% | -1.06% |
| 2023 | 11 | 45.5% | -1.04% |
| 2024 | 12 | 58.3% | +3.73% |
| 2025 | 9 | 44.4% | -9.46% |
| 2026 | 7 | 42.9% | -3.13% |
Calculated on historical prices; not actual trades. Fees and slippage not included.
The year table shows why a single-period backtest misleads. 2021 was the good year, with 70.0% of events closing higher and a median of +1.21%. 2024 followed with 58.3% and +3.73%. Everything else sat at or below a coin flip, and 2025 produced a median of -9.46% across 9 events. The technique did not decay smoothly; it worked in trending years and hurt in choppy ones.
Split: close above vs below the 200-day EMA (move after 7 days)
| Group | Events | Closed higher | Median move | Worst |
|---|---|---|---|---|
| Close above EMA 200 | 39 | 53.8% | +1.06% | -16.1% |
| Close below EMA 200 | 17 | 47.1% | -1.06% | -17.2% |
Calculated on historical prices; not actual trades. Fees and slippage not included.
Context helps a little. Breakouts that printed with the close above the 200-day EMA, 39 of them, closed higher 53.8% of the time with a median of +1.06%. The 17 that printed below it closed higher 47.1% of the time with a median of -1.06%. The worst case was bad on both sides, -16.1% above and -17.2% below, so the filter shifted the center without removing the tail.
Where it failed
The three worst 7-day outcomes were all breaks into weakness. On 2022-09-10 00:00 UTC, at 1,773, the move was -17.2% with a dip of -20.9% along the way, and the break never held. On 2024-04-08 00:00 UTC, at 3,698, the result was -16.1% with a dip of -24.5%. On 2024-03-11 00:00 UTC, at 4,071, it was -13.4% with a dip of -16.1%, a break in a market that had already run hard and then reversed sharply.
The pattern in all three is the same: the breakout printed, follow-through was absent in the first days, and the drawdown inside the window was larger than the final loss. The best cases behaved differently from the start. On 2025-07-09 00:00 UTC the move was +21.8% with a worst dip of only -0.5%, and on 2021-04-27 00:00 UTC it was +21.6% with a dip of -4.0%. Breakouts that worked tended to work immediately.
How to read it on your chart
If you use this signal, consider treating it as a context flag rather than a decision. Three checks are supported by what we measured. First, position relative to the long-term trend, since events above the 200-day EMA were the better half of the sample. Second, the behavior of the first days, because the best cases barely went underwater while the worst ones failed early. Third, your own tolerance for the path: half the events dipped more than 5% inside the week, so a stop tighter than that would have been hit in many cases that later recovered.
What invalidates the read is a close back below the broken level, which turns the break into a failed one and puts price inside the range again. On the chart above, notice how the blue dots sit against the 20-bar high line, and that several of them mark the end of a move rather than the start of one. That is the visual version of a 51.8% hit rate.
How the Pullwave indicator approaches this
Pullwave is an invite-only TradingView indicator. It is rule-based, with fixed rules on price and volume and no discretion. Its rules are not published, it does not predict the future, and it has losing trades. On the chart above its marks are the gold arrows, while the blue dots are the breakout events we tested, so you can compare where each one chose to speak on the same candles.
The difference worth noticing is scope. A single-condition trigger, like the one measured here, answers only one question: has something just happened. A complete rule set has to answer more, namely when to add, when to take partial profit and when to exit. Pullwave marks long and short entries, add-ons, partial exits and exits, and it can send a TradingView alert when a mark prints. The futures version is built around SOLUSDT perpetual futures, and the spot version runs on major coins. The user places any orders themselves; the indicator only draws marks and sends alerts.
Key takeaways
- Across 56 events on ETHUSDT daily candles, a close above the prior 20-day high was followed by a higher close 51.8% of the time after 7 days, against a 51.6% baseline, which is effectively no edge in hit rate.
- The distribution is wide: the middle half of 7-day outcomes ran from -6.1% to +7.2%, and 50.0% of events dipped more than 5% before the window ended.
- Results were concentrated in trending years. 2021 showed 70.0% higher closes, while 2025 showed a median of -9.46%.
- If you use this technique, consider filtering by the longer-term trend: events above the 200-day EMA showed 53.8% higher closes versus 47.1% below it, although the worst cases were similar on both sides.
- Any real use would also have to absorb fees, funding and slippage, which this test excludes.
The gold arrows on the chart are marks from the Pullwave indicator for TradingView. See how the Pullwave indicator works on pullwave.net.
Chart rendered with TradingView Lightweight Charts™ from real exchange candles. tradingview.com