SOLUSDT leverage test: 10x liquidated in 44.5% of 7-day windows
We sampled 2218 daily SOL perpetual entries and measured the worst adverse move. At 10x, 44.5% of longs and 45.8% of shorts reached an approximate liquidation price within 7 days.
- Market
- SOLUSDT perpetual futures
- Timeframe
- 1H
- Data
- Sep 2020 – Oct 2026
- Sample
- 2218 samples
Every perpetual exchange shows you a leverage slider, and the slider looks like a choice about profit. It is really a choice about distance. The higher the multiplier, the shorter the adverse move that ends the position for you, and that distance has nothing to do with how good your idea was.
So we asked a mechanical question with no setup and no opinion in it: if you had opened a SOL perpetual position at a random daily open, with no stop, no added margin and no management, how often would 2x, 3x, 5x, 10x or 20x leverage have reached an approximate liquidation price within 7 days or 30 days? The answer is a floor. It is the survival rate of a position chosen for no reason, and any real technique has to beat it to justify the leverage it uses.
What Leverage and liquidation risk measures
Leverage measures how large a position is relative to the margin backing it. With isolated margin the arithmetic is simple enough to do in words: the adverse move that consumes the margin is roughly one divided by the leverage, and the exchange closes the position slightly before that, because it holds back a maintenance margin. So the usable distance is approximately 1/leverage minus the maintenance margin. We assumed a maintenance margin of 0.5%.
That produces the distances in the first column of the table below: 49.5% at 2x, 32.8% at 3x, 19.5% at 5x, 9.5% at 10x and 4.5% at 20x. Read those as travel room, measured from the entry price, in the direction you do not want. A long is liquidated by the lowest price reached while the position is open, a short by the highest. Nothing in between matters, including where price eventually settles.
The reading most traders are taught is to compare that travel room with the instrument's normal adverse excursion. If a market routinely wanders further against an entry than the liquidation distance allows, the multiplier is doing the deciding, not the analysis. This test puts numbers on "routinely".
The test
We used Binance USDⓈ-M perpetual SOLUSDT candles on the 1H timeframe, from Sep 2020 to Oct 2026, which is 53398 bars. All times are UTC.
The rule is one sample entry per day at 00:00 UTC, taken at the close of the signal bar, which gave 2218 entries. For each entry we measured, over the next 7 days and again over the next 30 days, the lowest 1H low (the worst case for a long) and the highest 1H high (the worst case for a short). An entry counts as liquidated at a given leverage if that worst excursion reached the approximate liquidation distance, 1/leverage minus the 0.5% maintenance margin, isolated margin, with no margin added at any point.
There is no selection here, and that is deliberate. The baseline for this article is the "any bar" case, so the sample is the baseline: every day in the period is included, with no filter, pattern or trend condition. The cooldown is the daily spacing itself, one entry per day. Because of that, the windows of neighboring entries overlap heavily, the samples are not independent, and one violent week contributes several entries at once.
These figures were calculated on historical prices; they are not actual trades. Fees, slippage and funding payments are not included, and funding would push a real position closer to its liquidation price over a long hold. Exchanges also raise maintenance margin for large positions, which would shorten the distances further.
Results
Daily entries that would have hit an approximate liquidation price
| Leverage | Approx. adverse move to liquidation | Long liquidated within 7 days | Short liquidated within 7 days | Long liquidated within 30 days | Short liquidated within 30 days |
|---|---|---|---|---|---|
| 2x | 49.5% | 0.8% | 4.4% | 6.1% | 21.3% |
| 3x | 32.8% | 3.7% | 8.4% | 22.8% | 31.1% |
| 5x | 19.5% | 14.3% | 20.2% | 45.1% | 50.3% |
| 10x | 9.5% | 44.5% | 45.8% | 68.8% | 71.2% |
| 20x | 4.5% | 70.7% | 68.5% | 85.2% | 84.7% |
Calculated on historical prices; not actual trades. Fees and slippage not included.
The low multipliers behave the way they are advertised. At 2x, with 49.5% of room, 0.8% of long entries and 4.4% of short entries reached liquidation within 7 days; over 30 days that becomes 6.1% and 21.3%. At 3x, with 32.8% of room, the 7-day figures are 3.7% and 8.4%, and the 30-day figures are 22.8% and 31.1%.
Two things stand out. First, the asymmetry at low leverage: shorts were liquidated more often than longs at 2x and 3x. Over this period SOL produced large upward excursions, and a fixed percentage distance is reached more easily by a market that can rise a long way quickly. Second, the asymmetry fades as leverage rises. At 10x the 7-day figures are 44.5% for longs and 45.8% for shorts; at 20x they are 70.7% and 68.5%. Once the distance is short enough, ordinary two-sided noise does the liquidating and direction almost stops mattering.
The middle of the table is where most retail positions sit. At 5x, 14.3% of longs and 20.2% of shorts were liquidated within 7 days, and over 30 days 45.1% and 50.3%. At 20x over 30 days, 85.2% of longs and 84.7% of shorts reached the distance.
The medians explain why. The median worst 7-day dip after a random entry was -8.1%, and the median worst 7-day rise against a short was +8.6%. Compare those with 9.5% of room at 10x and 4.5% at 20x. A typical week on this market produces an adverse excursion of the same order as the entire cushion at 10x. Nothing unusual has to happen.
Where it failed
The worst 7-day outcomes cluster on three consecutive days. The entry dated 2022-11-06 at 36.42 saw a worst dip of -74.1%. The entry dated 2022-11-05 at 34.92 saw -73.0%, and the entry dated 2022-11-07 at 32.37 saw -70.9%. Those dates sit on the November 2022 FTX collapse, and SOL was among the assets most closely associated with it.
At those excursions every tier in the table is irrelevant, including 2x with its 49.5% of room. That is the honest limit of a leverage calculation: it tells you how much normal movement you can absorb and says nothing about an event that travels further than any reasonable cushion. The mirror case exists on the short side, with a worst 7-day rise of +118.0% in the sample. Note the clustering too. Three adjacent entries, one event. The percentages describe days, not independent trades.
How to read it on your chart
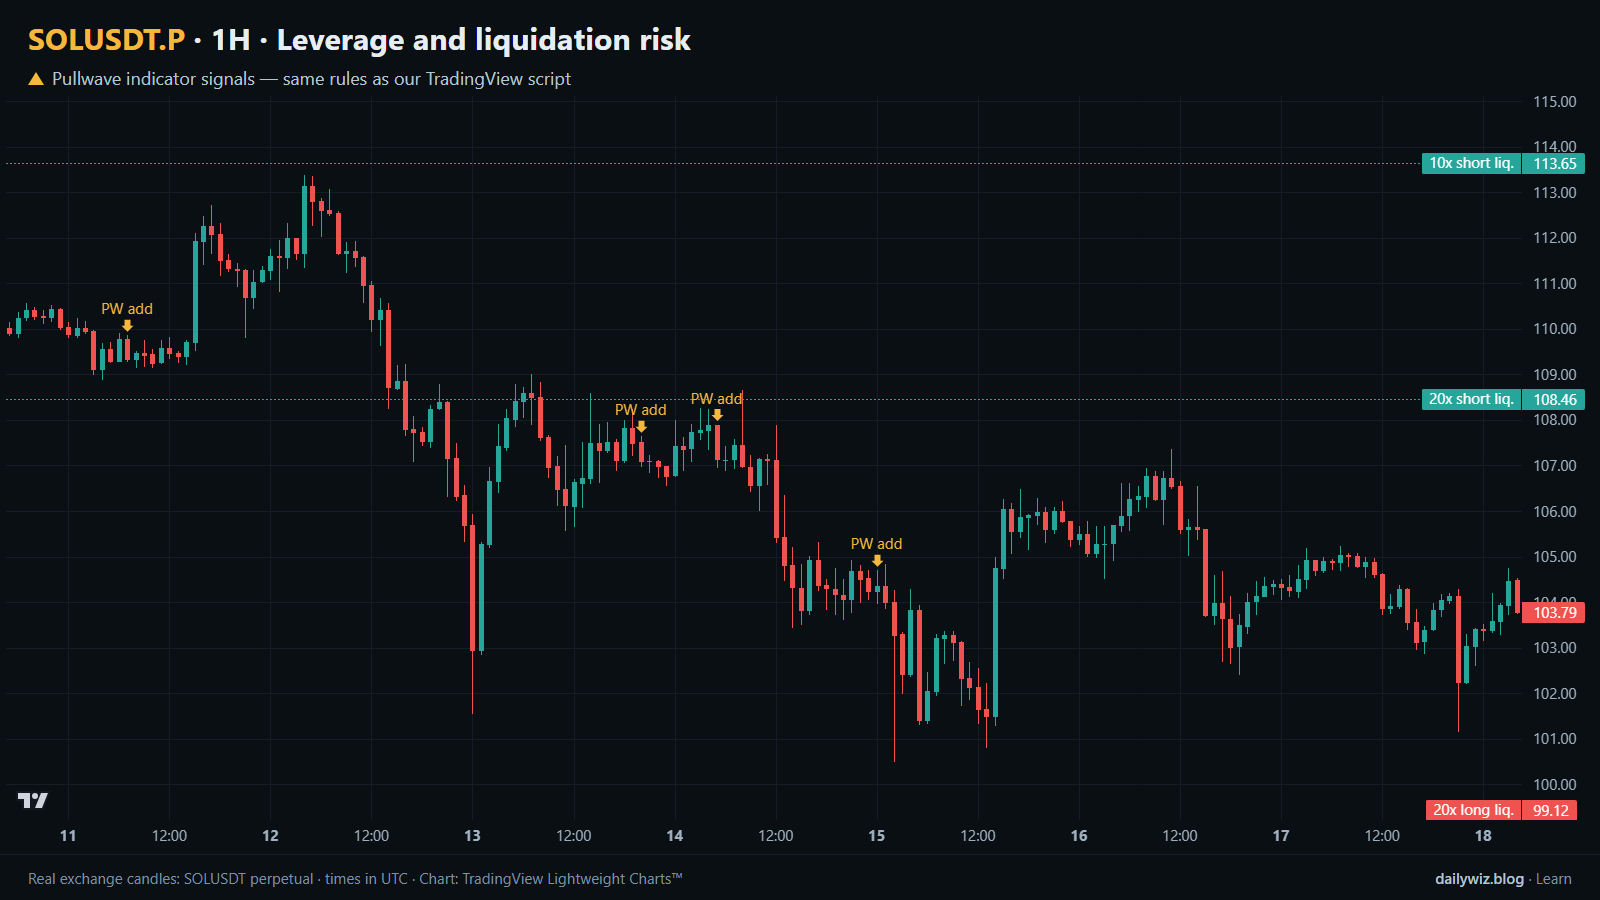
The chart above is drawn differently from most articles in this series. Because the rule samples a fixed daily time rather than a pattern condition, there are no blue dots in this window. Instead we drew the liquidation distances as price lines across 180 1H bars: 5x, 10x and 20x long liquidation lines, plus 10x and 20x short liquidation lines. The useful exercise is to see how the 20x lines sit relative to ordinary candle wicks over a single week.
If you use leverage, the check worth doing is the one this test automates: measure recent adverse excursions on your own timeframe, then compare them with the distance your multiplier leaves. If the normal wander is wider than the cushion, the outcome is decided by noise regardless of the thesis.
Several things change the numbers above. A stop placed well inside the liquidation distance changes the question entirely, because then you choose the exit. Cross margin moves the risk to the whole account rather than one position. Adding margin postpones liquidation but increases the amount at risk. Holding time is the variable traders underestimate most: every 30-day column is worse than its 7-day counterpart, so the same multiplier is a different risk depending on how long you intend to stay.
How the Pullwave indicator approaches this
Pullwave is an invite-only TradingView indicator, rule-based, with fixed rules on price and volume and no discretion. On the chart above its marks are the gold arrows, taken from the public record on pullwave.net, which uses the same rules as the script. The blue dots of the tested technique are absent here because that rule fires on a clock rather than on a chart condition, and the comparison is instructive: the arrows mark entries, add-ons, partial exits and exits, while the liquidation lines are a fixed consequence of a multiplier.
That difference is the takeaway a reader can use. The technique tested here is a single-condition trigger, and a single condition on its own is noisy. A complete rule set has to answer the other questions as well: when to add, when to take partial profit and when to exit. The futures version is built around SOLUSDT perpetual futures; the spot version runs on major coins. Its rules are not published, it does not predict the future, and it has losing trades. It can send a TradingView alert when a mark prints, but the user places any orders themselves.
Key takeaways
- What matters is the approximate liquidation distance, not the multiplier: 49.5% at 2x down to 4.5% at 20x, assuming a 0.5% maintenance margin and no added margin.
- On 2218 daily SOL perpetual samples, 44.5% of longs and 45.8% of shorts at 10x reached that distance within 7 days, which the test suggests is close to a coin flip on noise alone.
- The median worst 7-day excursion was -8.1% for longs and +8.6% for shorts, so a typical week already covers the whole cushion at 10x.
- Holding time compounds the risk: every 30-day figure is worse than the 7-day figure for the same leverage, and fees, slippage and funding are not included.
- No cushion survives an event like November 2022, when the worst 7-day dip reached -74.1%; if you use leverage, consider sizing and an exit you control rather than treating the liquidation price as a backstop.
The gold arrows on the chart are marks from the Pullwave indicator for TradingView. See how the Pullwave indicator works on pullwave.net.
Chart rendered with TradingView Lightweight Charts™ from real exchange candles. tradingview.com