ATR stops on BTC/USDT 1H: how often is a 2 x ATR stop touched?
We sampled 1435 entries on BTC/USDT 1H candles from Nov 2022 to Oct 2026. A 1 x ATR(14) stop was touched within three days 85.9% of the time on longs, while a fixed 5% stop was touched 17.8%.
- Market
- BTC/USDT spot
- Timeframe
- 1H
- Data
- Nov 2022 – Oct 2026
- Sample
- 1435 samples
A stop loss has one job: to end a trade before it damages the account. But protection has a price, and that price is not the distance in percent. It is the chance that ordinary noise reaches the stop before the trade has had time to work.
The usual crypto answer is to size the stop with volatility instead of a round number: a multiple of the Average True Range. An ATR stop is said to adapt, widening when the market is wild and tightening when it is quiet. That sounds reasonable, but it leaves the practical question open. On BTC/USDT 1H candles, how often does a stop placed 1, 1.5, 2 or 3 ATRs away actually get touched within three days, and how does that compare with a flat 2% or 5%? We counted.
What ATR-based stop losses measures
The Average True Range measures volatility, not direction. It starts from the true range of each bar: the largest of high minus low, the distance from the previous close to the current high, and the distance from the previous close to the current low. Including the previous close is what makes the range "true" — a violent opening counts as movement instead of being ignored.
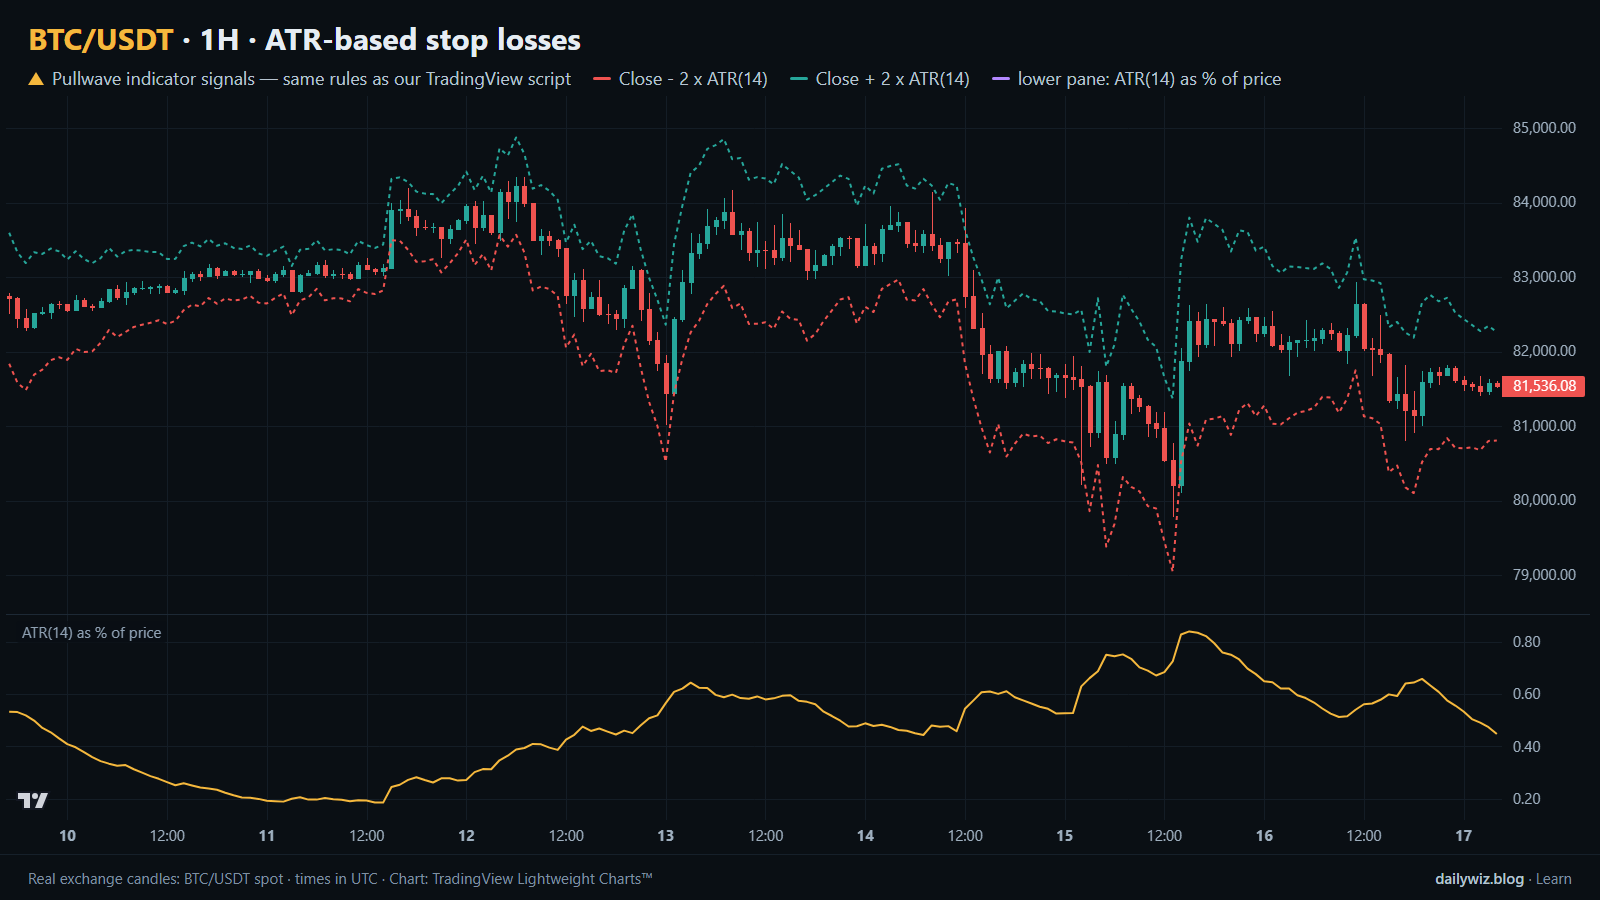
Those ranges are then smoothed, classically with Wilder smoothing over 14 periods, which gives the newest bar a small weight and lets older bars decay gradually. The output is in price units, so traders usually convert it into a percentage of price in order to compare different periods, which is what the lower pane of the chart above shows.
The standard reading is as a unit of normal movement. One ATR is roughly one bar's worth of range, so a stop at 1 x ATR accepts that a single average bar going the wrong way ends the trade. Common multipliers are 1, 1.5, 2 and 3, with 2 the most quoted default. The hidden assumption is that the multiplier, not the distance, should stay constant.
The test
The data is Binance BTC/USDT spot candles on the 1H timeframe: 34709 bars from Nov 2022 to Oct 2026, timestamps in UTC. Every 24 hours we took a sample entry at the 1H close, once as a long and once as a short, which gave 1435 samples. We deliberately filtered nothing — the goal was to measure what an average bar does to a stop, so the unfiltered entry is itself the "any bar" baseline.
For each sample we placed six stops: at 1, 1.5, 2 and 3 times ATR(14) from the entry close, with Wilder smoothing, plus a fixed 2% and a fixed 5%. We then walked forward 72 bars, three days, and recorded whether price touched each level at any point inside that window. The outcome is binary, touched or not touched. We also logged each ATR stop's median distance in percent, so ATR and fixed stops can be compared like for like.
The one-sample-per-day cooldown keeps the result from being dominated by clusters of adjacent bars, though consecutive three-day windows still overlap. These figures were calculated on historical prices; they are not actual trades. Fees and slippage are not included, and a real stop can fill worse than the level that triggered it, so being stopped costs more in practice than the table shows.
Results
Share of random entries whose stop was touched within 3 days
| Stop | Median distance from entry | Long stop touched | Short stop touched |
|---|---|---|---|
| 1 x ATR(14) | 0.56% | 85.9% | 86.6% |
| 1.5 x ATR(14) | 0.84% | 78.3% | 80.2% |
| 2 x ATR(14) | 1.12% | 71.0% | 73.7% |
| 3 x ATR(14) | 1.68% | 60.1% | 62.2% |
| Fixed 2% | 2.00% | 54.2% | 56.3% |
| Fixed 5% | 5.00% | 17.8% | 19.9% |
Calculated on historical prices; not actual trades. Fees and slippage not included.
The first thing the table says is that ATR stops on hourly BTC are tight. A 1 x ATR(14) stop sits a median 0.56% from entry and the popular 2 x ATR(14) stop a median 1.12%, still inside a flat 2%. On an hourly chart, two ATRs is not a wide stop.
The hit rates follow the distance almost mechanically. The 1 x ATR stop was touched within three days 85.9% of the time on longs and 86.6% on shorts. At 1.5 x ATR, 78.3% and 80.2%. At 2 x ATR, 71.0% and 73.7%. Even at 3 x ATR, a median 1.68% away, it was touched 60.1% and 62.2%, while a flat 2% was touched 54.2% and 56.3% and a flat 5% only 17.8% and 19.9%.
There is no magic in the multiplier on this sample: the touch rate tracks the distance, and the ATR multiples traders treat as generous sit closer than a round 2%. The stop above price was also touched slightly more often than the stop below it in every row.
Long stops by volatility regime (within 3 days)
| Regime | Median ATR as % of price | 2 x ATR stop touched | Fixed 5% stop touched |
|---|---|---|---|
| Calm third (lowest ATR%) | 0.37% | 75.2% | 11.3% |
| Middle third | 0.56% | 73.6% | 18.0% |
| Volatile third | 0.81% | 64.2% | 24.3% |
Calculated on historical prices; not actual trades. Fees and slippage not included.
Splitting the longs into thirds by ATR as a percentage of price at entry sharpens the point. In the calm third, median ATR was 0.37% of price and the 2 x ATR stop was touched 75.2% of the time. In the volatile third, median ATR was 0.81% and the same stop was touched 64.2%. The fixed 5% stop ran the other way: 11.3% in the calm third against 24.3% in the volatile third. The fixed stop behaved as expected; the ATR stop inverted it, because its distance shrank with volatility faster than the noise did.
Where it failed
The clearest failure here is a regime, not a date. Calm markets are where ATR stops did worst: a 75.2% touch rate on a stop the trader believed was volatility-adjusted. When median ATR falls to 0.37% of price, 2 x ATR is a very small distance, and one or two larger-than-average bars inside a 72-bar window reach it. Compression does not mean the market stopped wobbling; it means the yardstick shrank.
The tight end of the table fails for the same reason. At 1 x ATR(14), a median 0.56% away, the stop was touched 85.9% of the time on longs — not much of a risk control on an hourly chart. And because the period runs from Nov 2022 to Oct 2026, covering the aftermath of the November 2022 FTX collapse at one end and quiet consolidation at the other, every figure here is an average across very different markets.
How to read it on your chart
The chart above shows 180 1H candles with the Close - 2 x ATR(14) and Close + 2 x ATR(14) lines drawn around price, and ATR(14) as a percentage of price in the lower pane. There are no blue dots in this window, because what we tested is a distance rather than an entry trigger. Watch instead how the two lines breathe: they hug price when the lower pane falls and widen when it rises.
If you use ATR stops, consider reading the distance in percent before trusting the multiplier. The multiplier is constant; the protection is not. When the ATR% pane sits near the low end of its recent range, the usual multiple may be smaller than routine noise, and a floor on stop distance — or a smaller position with a wider stop — is the same risk expressed differently.
A different horizon invalidates any read from this test. Everything was measured over 72 bars, and a stop meant to live for hours faces another distribution. These were also unfiltered entries, so a stop attached to a real setup aligned with the higher-timeframe trend should not be expected to match the baseline. The baseline tells you what the average bar costs, which is the number your setup has to beat.
How the Pullwave indicator approaches this
Pullwave is an invite-only TradingView indicator, and it is rule-based: fixed rules on price and volume, with no discretion. Its rules are not published, it does not predict the future, and it has losing trades. On the chart it marks long and short entries, add-ons, partial exits and exits, and it can send a TradingView alert when a mark prints. The futures version is built around SOLUSDT perpetual futures; there is also a spot version for major coins. The user places any orders themselves — the indicator only draws marks and sends alerts.
The gold arrows on the chart above are Pullwave's marks on the same candles, taken from its public record, under the same rules as the TradingView script. Comparing them with the blue dots of the tested technique is the useful exercise. The general idea a reader can take from today's test is that a single-condition trigger is noisy on its own, while a complete rule set also has to answer when to add, when to take partial profit and when to exit — questions a stop distance alone does not touch.
Key takeaways
- On 1435 sample entries on BTC/USDT 1H candles, a 1 x ATR(14) stop was touched within three days 85.9% of the time on longs and 86.6% on shorts. Tight ATR stops fire constantly on an hourly chart.
- The 2 x ATR(14) default had a median distance of only 1.12% and was touched 71.0% of the time on longs, against 54.2% for a flat 2%.
- The adaptive claim did not hold in the expected direction: the 2 x ATR stop was touched 75.2% of the time in the calm third of the sample, versus 64.2% in the volatile third.
- If you use ATR stops, consider reading the distance in percent rather than the multiplier alone, and remember that fees and slippage make every stop-out more expensive than this test shows.
- The test suggests stop distance, hold window and position size are one decision, not three.
The gold arrows on the chart are marks from the Pullwave indicator for TradingView. See how the Pullwave indicator works on pullwave.net.
Chart rendered with TradingView Lightweight Charts™ from real exchange candles. tradingview.com