SOL Drawdowns: 7 Falls Past 20%, and 67 Days to a New High
We measured every drawdown in 2243 daily SOLUSDT candles. Seven episodes went deeper than 20%, the median recovery took 67 days, and the deepest fall reached -96.3%.
- Market
- SOLUSDT perpetual futures
- Timeframe
- 1D
- Data
- Sep 2020 – Nov 2026
- Sample
- 30 samples
Most trading education is about getting in. The number that decides whether you are still around to get in again is the drawdown: how far the market fell from its last high, and how long it stayed there. A strategy you can describe in one sentence is worthless if the waiting period between highs is longer than your patience or your funding.
So today we are not testing a signal. We are measuring the terrain. The question is simple and uncomfortable: for SOL, how deep have the falls from the running high been, how often did they happen, and how many days did it take before a new high printed again? The answers set a realistic expectation for anyone holding exposure through a cycle, and they also explain why most of the time a chart looks like it is "below the high" rather than making one.
What Drawdowns and recovery time measures
A drawdown is the distance between the current price and the highest price reached so far. You walk through the data bar by bar, keep track of the highest close you have seen (the running high), and for every bar you record how far below that high the close sits, in percent. When price makes a new high, the drawdown resets to zero.
An episode is the stretch between two highs. It begins when price falls below the running high by more than a chosen threshold and it ends on the day a new high is made. Recovery time is simply the number of days in that stretch. Common thresholds are 20%, 30% and 50%: the first marks a normal correction, the second a serious one, the third a regime change in which the asset has to roughly reverse its loss plus more to get even.
Traders usually read three things from this. First, the maximum drawdown, which is the worst the chart ever got. Second, the frequency of episodes, which tells you whether deep falls are a once-a-cycle event or a regular feature. Third, the median recovery time, which is a better guide than the average because one enormous episode can distort an average beyond use. A useful companion measure is the share of days spent a given distance below a rolling high, which describes the typical day rather than the extreme one.
The test
We used Binance USDⓈ-M perpetual SOLUSDT candles, daily timeframe, from Sep 2020 to Nov 2026, all timestamps in UTC. That is 2243 daily bars.
The rule: on daily closes, we track the running all-time high of this sample. A drawdown is the fall from that running high. An episode ends when a new high is made. We counted episodes that went deeper than 20%, 30% and 50%, and for each group we measured the number of days until a new high. Outcomes are measured close to close, from the close of the bar that breached the threshold to the close of the bar that set the new high. Because an episode by definition runs until the next high, episodes cannot overlap within a threshold group, which acts as a natural cooldown.
The baseline here is not a signal comparison but the typical day. Instead of asking what happens after a trigger, we asked what an arbitrary bar looked like: how often any given day sat well below a recent high. We used a rolling 90-day high for that, which keeps the comparison local rather than tied to a peak from years earlier.
These figures were calculated on historical prices; they are not actual trades. No fees, funding or slippage are included, and a real position would also have to survive the path between the two closes, not just the endpoints.
Results
Drawdowns from the running all-time high (daily closes)
| Drawdown | Episodes | Median days to a new high | Still not recovered |
|---|---|---|---|
| Deeper than 20% | 7 | 67 | 1 |
| Deeper than 30% | 5 | 97 | 1 |
| Deeper than 50% | 4 | 105 | 1 |
Calculated on historical prices; not actual trades. Fees and slippage not included.
The shape of the table is the main lesson. Falls deeper than 20% happened 7 times, with a median of 67 days to a new high. Falls deeper than 30% happened 5 times, median 97 days. Falls deeper than 50% happened 4 times, median 105 days. Deep episodes are not rare exceptions tacked onto an otherwise calm chart: most corrections that passed 20% kept going past 30%, and most of those passed 50%. On this sample, once SOL lost a fifth of its value from the high, the odds that it would also lose half were not small.
Recovery time grows with depth, as arithmetic requires, but the medians are more moderate than the depths suggest. Two to three months to a new high after a correction, a little over three months after a halving of price, is a survivable wait for a trader who sized the position for it. The caveat is in the last column: one episode in each row has not recovered, and it is excluded from every median. Medians computed only on completed episodes are optimistic by construction, because the slowest recovery is the one still running.
The baseline numbers reframe all of this. Across the sample, 78.4% of days closed more than 10% below the 90-day high, and 36.2% of days closed more than 30% below it. Being below a recent high is not an unusual state for this market; it is the normal state. New highs are the exception, which is why strategies that only feel comfortable near highs spend most of the calendar sitting on their hands.
Where it failed
The worst case in the sample is also the clearest. The maximum drawdown reached -96.3%, measured on daily closes, with the low point of that episode dated 2022-12-29 (UTC). That is the tail of the November 2022 FTX collapse, an event tied closely to SOL for reasons that had nothing to do with chart patterns. No drawdown study based on a running high gives any warning of that kind of move; it only records it afterward.
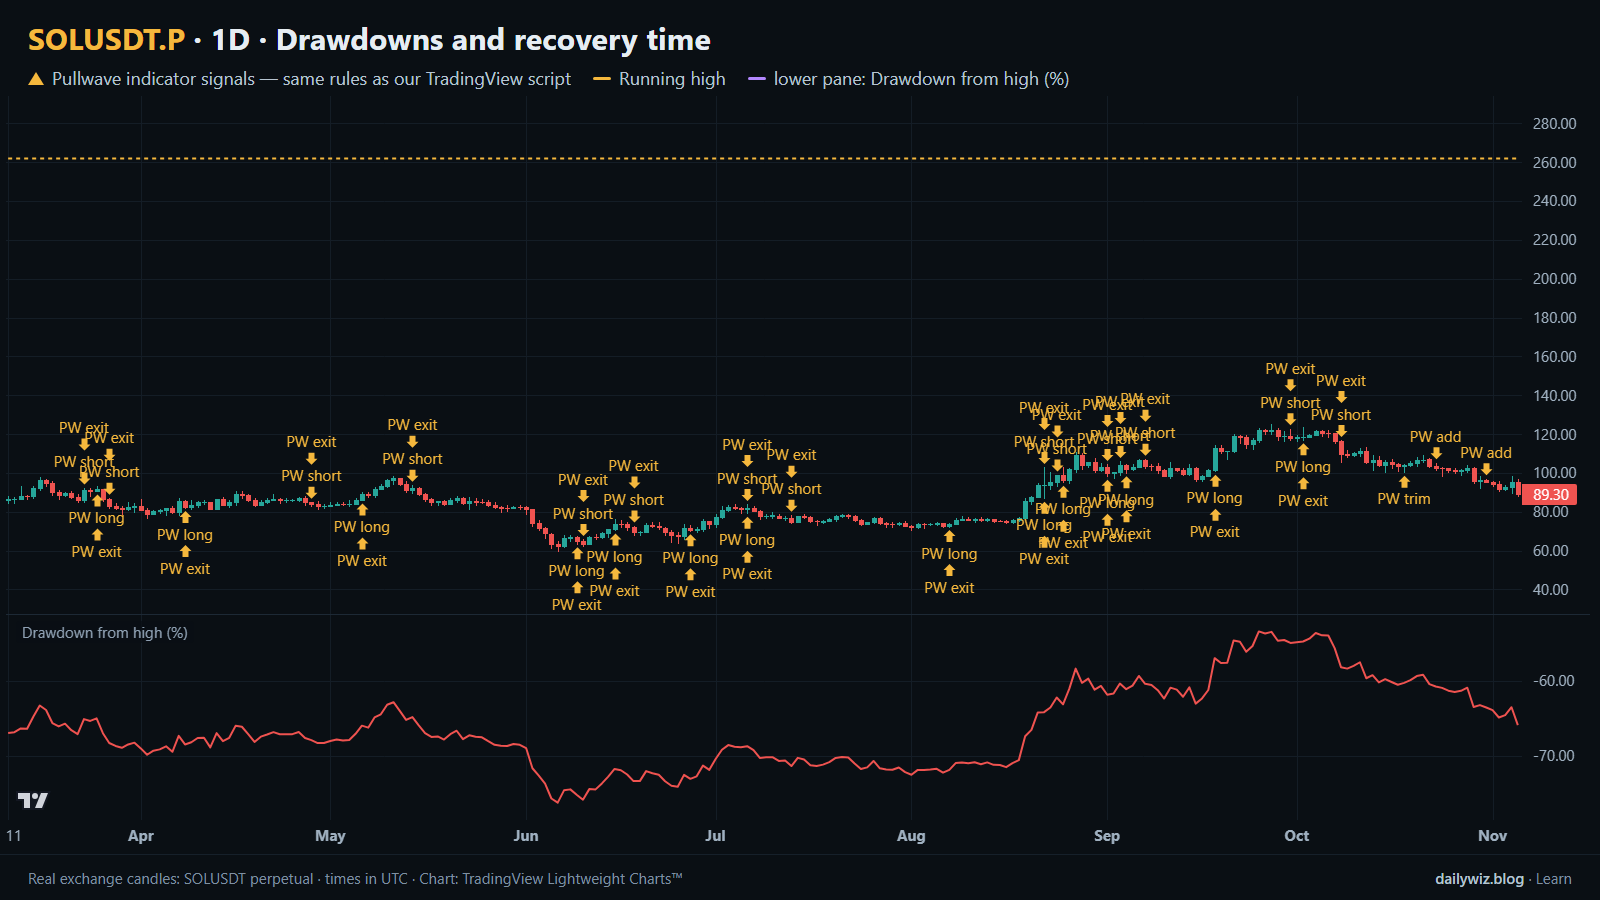
The second failure is quieter. At the end of the sample the chart sits -65.9% from the running high, and that episode is the one counted as not recovered in all three rows. Anyone who had read the medians at the start of it and planned around 67 or 97 days would have been wrong, and would have had no way to know in advance whether this episode belonged to the fast group or the long one. Median recovery is a description of the past distribution, not a countdown timer.
How to read it on your chart
The chart above shows the last 240 daily bars, from 2026-03-11 to 2026-11-05, with the running high drawn on price and the drawdown from the high in the lower pane. Notice that there are no blue dots in this window: no new threshold episode started here, because the chart has been inside an existing one. That is itself the reading. When the drawdown pane never touches zero across an entire screen, the market has not made a high for the whole period you are looking at.
If you use this measure, consider checking three things before trusting any conclusion from it. First, which high you are measuring from, since a running all-time high and a rolling 90-day high tell very different stories. Second, whether your sample includes a full cycle; a study that starts after a crash will understate depth. Third, whether the current episode is still open, because it will not appear in any median. What invalidates the comfortable reading is a new low in the drawdown pane: the episode clock restarts in practice, even if the definition says it was already running. Used as context rather than as a trigger, drawdown depth is mostly a position-sizing input, since it answers how much room the market has historically needed.
How the Pullwave indicator approaches this
Pullwave is an invite-only TradingView indicator that follows fixed rules on price and volume, with no discretion. On the chart it marks long and short entries, add-ons, partial exits and full exits, and it can send an alert when a mark prints. Its rules are not published, it does not predict the future, and it has losing trades.
The gold arrows on the chart above are Pullwave's marks on the same candles, taken from the public record on pullwave.net. Compare them with the blue dots of the technique tested here. A single-condition trigger like this one is noisy on its own; a complete rule set also has to answer when to add, when to take partial profit and when to step aside. Any orders are placed by the user; the indicator only draws marks and sends alerts.
Key takeaways
- Across 2243 daily SOLUSDT bars, there were 7 drawdowns deeper than 20%, 5 deeper than 30% and 4 deeper than 50%, so deep falls were a recurring feature rather than a one-off.
- Median recovery was 67 days past the 20% threshold, 97 days past 30% and 105 days past 50%, but one unrecovered episode is excluded from every median, which makes those figures optimistic.
- The deepest fall reached -96.3%, with its low dated 2022-12-29 (UTC), around the November 2022 FTX collapse; the chart ends -65.9% below the running high.
- Being below a high is normal: 78.4% of days closed more than 10% below the 90-day high and 36.2% closed more than 30% below it.
- If you use drawdown statistics, consider treating them as sizing context and as a patience check, not as an estimate of how long the current episode will last.
The gold arrows on the chart are marks from the Pullwave indicator for TradingView. See how the Pullwave indicator works on pullwave.net.
Chart rendered with TradingView Lightweight Charts™ from real exchange candles. tradingview.com