BTC/USDT by the clock: which UTC hours and weekdays move most?
We measured 35165 hourly BTC/USDT candles and 1465 daily closes: 14:00 UTC is the most active hour, the weekend averages 1.03% against 1.94% on weekdays, and direction stays near a coin flip.
- Market
- BTC/USDT spot
- Timeframe
- 1H
- Data
- Nov 2022 – Nov 2026
- Sample
- 35165 samples
Crypto never closes, and that is usually presented as an advantage. In practice, most traders quickly notice that the market does not treat every hour the same way. Some stretches feel thin and drifting, others produce the entire day's range in two or three candles. The question is whether that feeling survives measurement, and whether it is stable enough to be useful.
This article answers two narrow versions of that question on BTC/USDT: which UTC hours carry the largest average one-hour move, and whether weekends really go quiet compared with weekdays. We also check the part that matters most and is most often skipped — whether any of those labels tell you anything about direction, or only about size.
What Time-of-day and day-of-week behaviour measures
The calculation is deliberately simple. For every hourly candle we take the percentage change from the previous close to that candle's close. We strip the sign, which leaves the absolute size of the move regardless of whether it went up or down. Then we group every candle by the UTC hour stamped on it and average the absolute moves inside each group. The result is an activity map: twenty-four numbers describing how much the market typically travels in each hour of the day.
Alongside the size, we count the share of candles in each group that closed higher than they opened the hour at. That is the direction column. Size and direction are separate questions, and conflating them is the most common error in this kind of study.
The day-of-week version works the same way on daily candles stamped in UTC. For each weekday we count the days, the share that closed higher, the median move with its sign, and the average absolute move. The median is included because averages of signed returns are dominated by a handful of outliers, while the median describes the typical day.
Common variations: using local time instead of UTC, using the candle range instead of close-to-close, or grouping into sessions rather than single hours. The usual reading is as background context — when the tape is likely to be active — not as a trigger.
The test
The data is Binance BTC/USDT spot candles on the 1H timeframe, from Nov 2022 to Nov 2026, 35165 bars in total, and 1465 daily closes for the weekday table. All timestamps are UTC.
The rule is the measurement itself: average absolute 1H close-to-close move by UTC hour, and daily close-to-close moves by weekday, over the full sample. Outcomes are measured from the close of the signal bar to the close one bar later — for the hourly table that is the next hourly close, for the weekday table the next daily close. The baseline is any bar: every candle in the sample, regardless of its hour or weekday label. Because every bar is counted exactly once and no filter selects a subset, there are no overlapping windows and no cooldown is needed.
These figures were calculated on historical prices; they are not actual trades. No fees and no slippage are included, which matters more than usual here: hours with small average moves are exactly the hours where costs eat the largest share of any move.
Results
Most and least active hours (UTC): average absolute 1-hour move
| Hour (UTC) | Avg |1H move| | Closed higher |
|---|---|---|
| 14:00 | 0.49% | 50.7% |
| 15:00 | 0.46% | 51.1% |
| 13:00 | 0.39% | 45.8% |
| 17:00 | 0.38% | 53.9% |
| 05:00 | 0.24% | 48.9% |
| 04:00 | 0.23% | 50.6% |
| 10:00 | 0.23% | 50.9% |
Calculated on historical prices; not actual trades. Fees and slippage not included.
The size differences are real and large. The most active hour is 14:00 UTC at 0.49%, followed by 15:00 UTC at 0.46%, then 13:00 UTC at 0.39% and 17:00 UTC at 0.38%. The quietest end of the day sits at 05:00 UTC with 0.24%, and 04:00 UTC and 10:00 UTC with 0.23% each. Comparing the most active hour with the least active one, 14:00 UTC against 10:00 UTC, gives a ratio of 2.1x. In other words, the same instrument typically travels about twice as far in one hour as in another, purely as a function of the clock. The busy block lines up with the US cash session open and the hours around it.
The direction column tells a very different story. The share of candles that closed higher is 50.7% at 14:00 UTC, 51.1% at 15:00 UTC, 53.9% at 17:00 UTC, 50.9% at 10:00 UTC, 50.6% at 04:00 UTC, 48.9% at 05:00 UTC and 45.8% at 13:00 UTC. Those are clustered around the halfway mark, which is what the baseline of any bar looks like. Knowing the hour tells you how far price is likely to move, not which way.
Day of the week (UTC daily closes)
| Day | Days | Closed higher | Median move | Avg |move| |
|---|---|---|---|---|
| Monday | 209 | 52.6% | +0.18% | 2.04% |
| Tuesday | 209 | 48.8% | -0.11% | 1.88% |
| Wednesday | 210 | 49.5% | -0.07% | 2.06% |
| Thursday | 210 | 45.2% | -0.29% | 1.86% |
| Friday | 209 | 50.7% | +0.05% | 1.88% |
| Saturday | 209 | 52.6% | +0.05% | 0.70% |
| Sunday | 209 | 52.2% | +0.03% | 1.36% |
Calculated on historical prices; not actual trades. Fees and slippage not included.
The weekday table repeats the pattern at a slower frequency. Average absolute moves on weekdays run from 1.86% on Thursday to 2.06% on Wednesday, while Saturday sits at 0.70% and Sunday at 1.36%. Aggregated, the weekend averages 1.03% against 1.94% on weekdays. So yes, the weekend is measurably quieter, and Saturday carries almost all of that quietness; Sunday already starts waking up.
Direction again stays modest. Monday and Saturday closed higher 52.6% of the time, Sunday 52.2%, Thursday 45.2%. Median moves are tiny in both signs: +0.18% on Monday, -0.29% on Thursday, +0.05% on Friday and Saturday, +0.03% on Sunday. Each weekday has only 209 or 210 observations, which is a small sample for a direction claim.
Where it failed
The clearest failure is the directional reading. Thursday's 45.2% looks like a bearish day, but it rests on 210 days and a median of -0.29%, which is inside the noise of ordinary daily variation. The same applies to 13:00 UTC at 45.8%: it is one of the most active hours by size, yet the weakest by share of higher closes. If activity and direction were connected, that combination should not appear. Treating either number as a usable bias is where this technique breaks.
The second failure mode is hidden inside the averages. An hour with a 0.23% average still contains the sharpest candle of some weeks, and Saturday's 0.70% average does not prevent a violent weekend move — thinner books can make those moves worse, not better. A map of typical behaviour says nothing about the untypical day.
Third, the sample spans Nov 2022 to Nov 2026, starting in the month of the FTX collapse and running through very different volatility regimes. A single table over that whole span averages those regimes together. The hour map is likely to be more stable than the weekday map, because it is tied to when institutions are at their desks, but neither is a constant of nature.
How to read it on your chart
First, check your timezone. Every number here is UTC, and most charting platforms default to local or exchange time. A one-hour offset turns the busiest hour into an ordinary one.
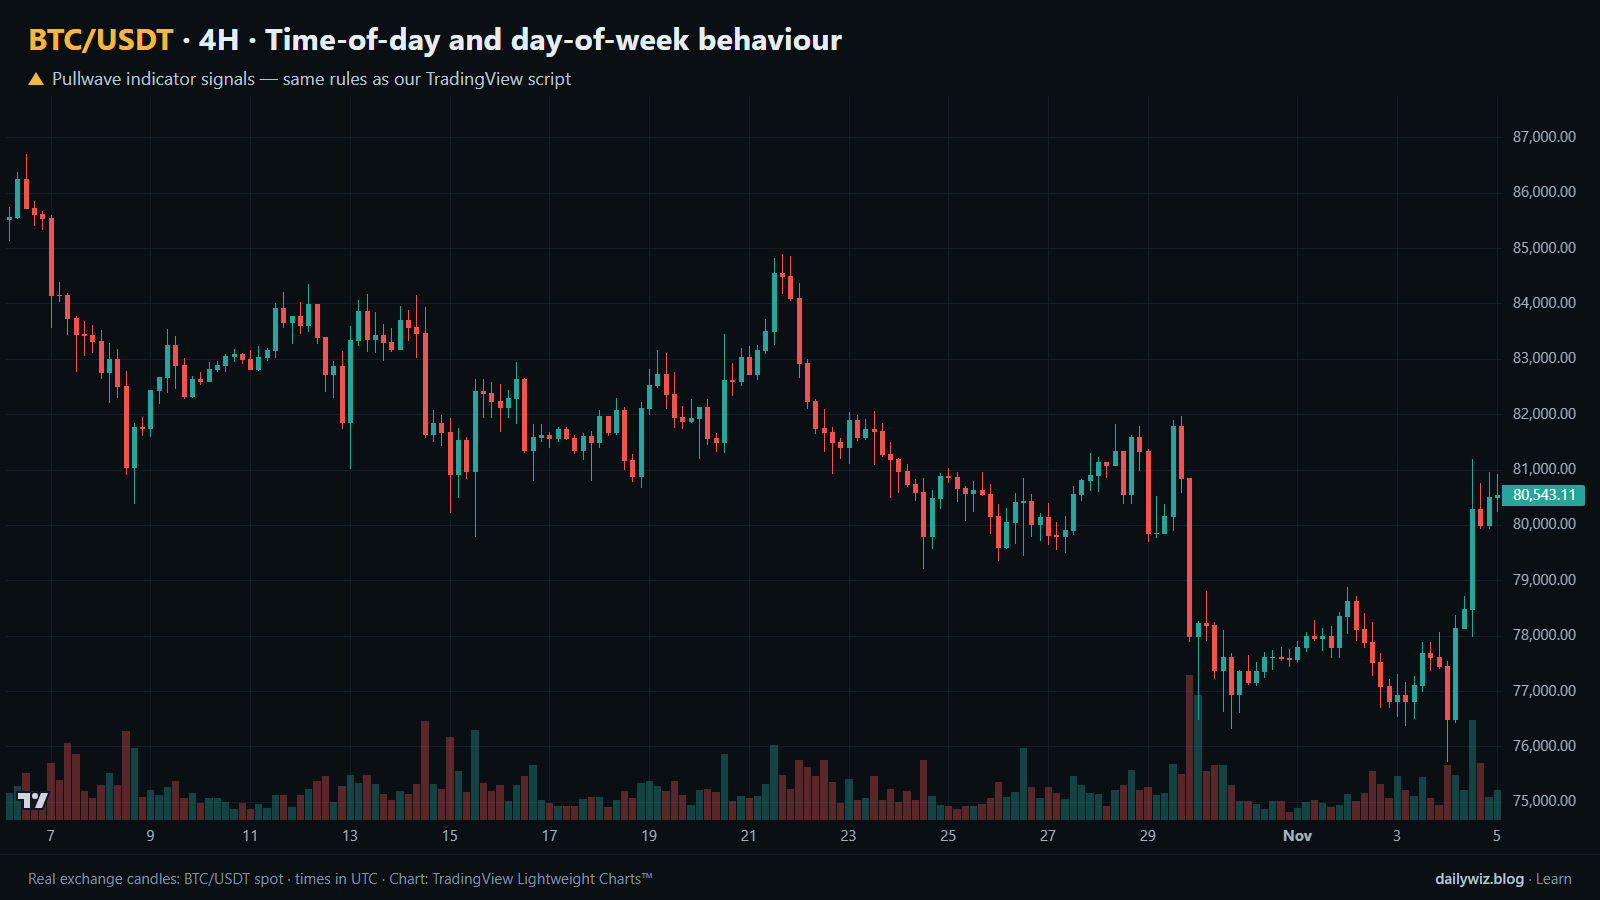
Second, note what the chart above does not show. This study has no discrete events — every candle is an observation — so there are no blue dots to mark. The output is background context, not a trigger.
If you use it, consider it as a sizing and expectation filter rather than a signal. A breakout that prints during a quiet hour has less typical follow-through behind it than the same pattern at the active hours; a stop placed at a fixed percentage means something different at 0.49% average movement than at 0.23%. It is also worth checking whether your own strategy's entries cluster in one part of the day, since that concentration may explain more of your results than the entry rule does.
What invalidates it: a different market, a different quote currency, or a scheduled macro release that moves the active window. The test suggests the clock describes size, so any conclusion you draw about direction from it should be treated as unsupported.
How the Pullwave indicator approaches this
Pullwave is an invite-only TradingView indicator. It is rule-based: fixed rules on price and volume, with no discretion, and those rules are not published. On the chart it marks long and short entries, add-ons, partial exits and exits, and it can send a TradingView alert when a mark prints. It does not predict the future and it has losing trades; the user places any orders themselves, since the indicator only draws marks and sends alerts.
On the chart above, the gold arrows are Pullwave's marks on the same candles, taken from the public record on its site, which follows the same rules as the script. Where the tested technique produces blue dots for each event it defines, a complete rule set behaves differently: in a stretch with no qualifying conditions, no arrows print at all.
That is the general idea a reader can take away here. A single-condition trigger, like the clock label tested in this article, is noisy on its own. A complete rule set also has to answer when to add, when to take partial profit and when to exit.
Key takeaways
- Size varies strongly by the clock: 14:00 UTC averages 0.49% per hour against 0.23% at 10:00 UTC, a ratio of 2.1x on BTC/USDT over this sample.
- The weekend is genuinely quieter, averaging 1.03% against 1.94% on weekdays, with Saturday at 0.70% carrying most of that gap.
- Direction is close to the baseline everywhere: higher-close rates cluster near half, and the outliers such as Thursday's 45.2% rest on about 210 days each.
- If you use this, consider it for sizing, stop width and cost expectations rather than as an entry reason, and confirm your chart is set to UTC before relying on any hour label.
The gold arrows on the chart are marks from the Pullwave indicator for TradingView. See how the Pullwave indicator works on pullwave.net.
Chart rendered with TradingView Lightweight Charts™ from real exchange candles. tradingview.com