SOLUSDT: does a 4H trend filter improve 1H RSI oversold signals?
We tested 420 oversold events on 1H SOLUSDT candles and split them by the 4H trend. After one day, 50.4% closed higher, and the trend filter barely moved the hit rate.
- Market
- SOLUSDT perpetual futures
- Timeframe
- 1H
- Data
- Sep 2020 – Nov 2026
- Sample
- 420 events
When the 1H RSI dips below 30, one question arrives immediately: is this a place where price tends to bounce, or just a place where it is already weak. The standard advice is to zoom out. Check the higher timeframe, and only trust the oversold reading when the bigger trend agrees with it.
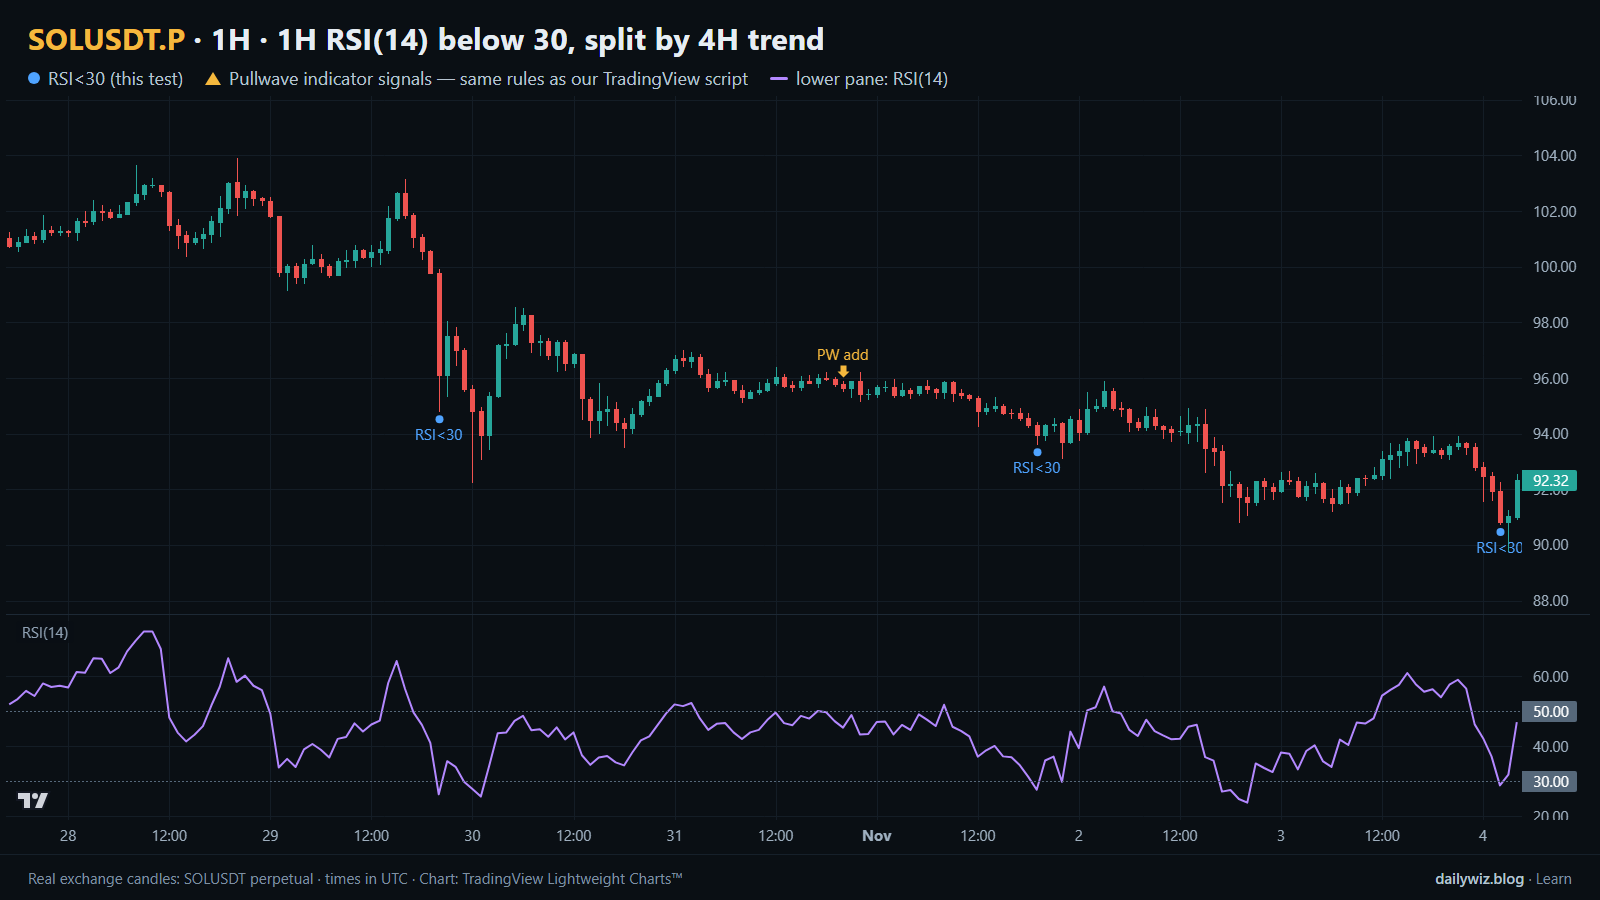
That is a reasonable idea, and it is testable. We took every 1H RSI(14) cross below 30 on SOLUSDT perpetual futures, labelled each one by whether the last completed 4H bar closed above or below its 4H EMA 50, and measured what happened next. On the chart above, blue dots mark the oversold events, the lower pane shows RSI(14), and the gold arrows are a separate comparison we return to at the end.
What Multi-timeframe analysis measures
Multi-timeframe analysis is not an indicator. It is a way of combining two readings of the same market: a trigger from a fast chart and a context filter from a slower one. The fast chart says something just happened. The slow chart says what kind of environment it happened in.
The trigger here is the Relative Strength Index. RSI(14) compares the average size of up closes with the average size of down closes over the last 14 bars and expresses the result on a scale from 0 to 100. When selling has dominated, the value falls; a cross below 30 is the conventional oversold mark, 70 the overbought one. Those settings are the default almost everywhere.
The context filter is an exponential moving average of the 4H closes over 50 bars. An EMA weights recent closes more heavily than older ones, so it turns faster than a simple average of the same length. Traders read it as a crude trend line: price above it is called an uptrend, price below it a downtrend. The usual instruction is to act on oversold readings only while the slower chart sits above its average, and to skip them otherwise.
The test
We used Binance USDⓈ-M perpetual SOLUSDT candles on the 1H timeframe, from Sep 2020 to Nov 2026, which is 53806 bars. All timestamps are UTC.
The rule is mechanical. An event is recorded when RSI(14) crosses below 30 on a closed 1H bar, with a cooldown of 24 bars so one long slide does not produce a cluster of near-identical entries. That produced 420 events. Each event was then labelled by the last completed 4H bar: close above its 4H EMA 50, or close below it.
Outcomes run from the close of the signal bar to the close 4 hours, 1 day and 3 days later, with 1 day as the main horizon. Events too close to the end of the data have no full outcome, which is why the horizon samples are 419, 419 and 418. As a reference we measured the same horizons starting from any bar in the period, which we call the baseline. If the signal carries no information, its numbers should look like the baseline. These figures were calculated on historical prices; they are not actual trades. No fees, funding or slippage are included, and real execution would subtract from every column.
Results
What happened after the signal (1H RSI(14) below 30, split by 4H trend)
| After | Events | Closed higher | Median move | Middle half (25th / 75th pct) | Worst | Baseline: closed higher | Baseline: median |
|---|---|---|---|---|---|---|---|
| 4 hours | 419 | 53.9% | +0.16% | -0.9% / +1.3% | -14.6% | 49.9% | +0.00% |
| 1 day | 419 | 50.4% | +0.05% | -2.7% / +3.0% | -50.0% | 49.6% | -0.04% |
| 3 days | 418 | 51.4% | +0.28% | -4.9% / +5.4% | -70.4% | 49.9% | -0.02% |
Calculated on historical prices; not actual trades. Fees and slippage not included.
The shortest horizon is the only one that stands out. After 4 hours, 53.9% of events closed higher against a baseline of 49.9%, with a median of +0.16% against a baseline median of +0.00%. That is a small positive tilt, consistent with a short bounce after a fast drop.
It fades. After 1 day, 50.4% closed higher versus a 49.6% baseline, with a median of +0.05%. After 3 days the share is 51.4% with a median of +0.28%, still near the baseline. The middle half of 1-day outcomes runs from -2.7% to +3.0%, so the typical result is ordinary volatility rather than signal. The tails are wide: the best 3-day outcome is +108.4%, the worst -70.4%.
The path matters as much as the destination. Within the 1-day window the median worst dip was -3.48%, the median best rise was +2.92%, and 35.5% of events dipped more than 5% before the day ended.
By year (move after 1 day)
| Year | Events | Closed higher | Median move |
|---|---|---|---|
| 2020 | 22 | 40.9% | -1.87% |
| 2021 | 51 | 58.8% | +1.95% |
| 2022 | 88 | 42.0% | -0.74% |
| 2023 | 62 | 61.3% | +1.04% |
| 2024 | 60 | 51.7% | +0.45% |
| 2025 | 71 | 52.1% | +0.06% |
| 2026 | 65 | 44.6% | -0.27% |
Calculated on historical prices; not actual trades. Fees and slippage not included.
By year the picture is unstable. 2021 and 2023 show 58.8% and 61.3% closing higher with positive medians, while 2020, 2022 and 2026 show 40.9%, 42.0% and 44.6% with negative medians. The regime did most of the work.
Split: 4H close above vs below its EMA 50 (move after 1 day)
| Group | Events | Closed higher | Median move | Worst |
|---|---|---|---|---|
| 4H close above its EMA 50 | 75 | 50.7% | +0.05% | -10.1% |
| 4H close below its EMA 50 | 344 | 50.3% | +0.06% | -50.0% |
Calculated on historical prices; not actual trades. Fees and slippage not included.
This is the table the article was built for, and it is flat. With the 4H close above its EMA 50, 75 events closed higher 50.7% of the time with a median of +0.05%. With the 4H close below, 344 events closed higher 50.3% of the time with a median of +0.06%. The filter did not improve the hit rate in any meaningful way. What it changed is the tail: the worst outcome in the uptrend group was -10.1%, against -50.0% in the downtrend group. It looks less like an edge generator and more like a disaster filter, and it discards most of the sample, because oversold readings naturally cluster below the average.
Where it failed
The worst case is 2022-11-09 01:00 UTC, which closed -50.0% one day later after dipping -57.1%. That is the middle of the November 2022 FTX collapse. Two days earlier, 2022-11-07 22:00 UTC gave -21.6% with a -37.4% dip. In both, RSI below 30 described continuing distress rather than exhausted selling.
The third worst is 2021-05-22 19:00 UTC, -27.0% with a -39.0% dip, during the May 2021 deleveraging. Note the symmetry: the best 1-day outcome, +37.4%, came from 2021-05-19 12:00 UTC, days earlier. The same reading in the same week produced the largest gain and one of the largest losses in the sample.
How to read it on your chart
If you use an oversold reading on a fast chart, treat it as a timing note, not a reason. Before trusting it, look at what produced the drop: an orderly pullback inside a rising structure is a different object from a vertical liquidation leg, even though RSI prints the same number. Check whether the slower chart is still making higher lows, and accept that when the 4H close sits below its EMA 50 the left tail is far larger, as the split table shows.
What invalidates the idea is easy to define in advance: a close below the low of the signal bar, or RSI failing to recover above 30 on the following bars. Because 35.5% of events dipped more than 5% within the day, a position sized as if the signal were reliable will be stopped out by normal noise.
On the chart above, the blue dots and the RSI pane show the recent events we logged, including 2026-10-29 20:00 UTC, which ended -1.0% a day later after a -4.0% dip, and 2026-11-01 19:00 UTC, which ended -2.4% after a -3.3% dip. Both are unremarkable, and that is the point.
How the Pullwave indicator approaches this
The gold arrows on the chart above come from Pullwave, an invite-only TradingView indicator, and they are worth comparing directly with the blue dots. The dots are one condition firing. The arrows are the output of a complete rule set: Pullwave is rule-based, built on fixed rules on price and volume with no discretion, and it marks long and short entries, add-ons, partial exits and exits, sending a TradingView alert when a mark prints. The futures version is built around SOLUSDT perpetual futures, and a spot version covers major coins. Its rules are not published, it does not predict the future, and it has losing trades. The general lesson here is independent of any product: a single-condition trigger is noisy on its own, and a complete method also has to answer when to add, when to take partial profit and when to exit. Compare where the arrows sit relative to the dots above. The user still places every order.
Key takeaways
- Across 420 events, the 1H RSI(14) cross below 30 on SOLUSDT gave 53.9% higher closes after 4 hours against a 49.9% baseline, and the tilt largely faded by 1 day at 50.4%.
- The 4H EMA 50 filter did not raise the hit rate: 50.7% above versus 50.3% below. If you use it, consider it as tail control, since the worst outcome was -10.1% above the average and -50.0% below it.
- Results are regime-dependent, from 61.3% higher closes in 2023 to 42.0% in 2022, so a test over one year would mislead you.
- The path is rough: the median worst dip within the day was -3.48% and 35.5% of events dipped more than 5%, which matters more for sizing than the median does.
- Fees, funding and slippage are not in these numbers, so a thin median like +0.05% would not survive real execution.
The gold arrows on the chart are marks from the Pullwave indicator for TradingView. See how the Pullwave indicator works on pullwave.net.
Chart rendered with TradingView Lightweight Charts™ from real exchange candles. tradingview.com