ETH/USDT 4H: Does a Bullish Engulfing at a 20-Bar Low Mark Bottoms?
We tested 18 bullish engulfing candles printed at a 20-bar low on ETH/USDT 4H candles. Three days later 50.0% closed higher, with a median of -0.04% against a 51.7% baseline.
- Market
- ETH/USDT spot
- Timeframe
- 4H
- Data
- Nov 2022 – Nov 2026
- Sample
- 18 events
A bullish engulfing candle at the bottom of a slide is one of the first patterns most traders learn. The story is intuitive: sellers pushed price to a new low, buyers took the candle back entirely, and the balance of power flipped inside a single bar. On a 4-hour chart that story feels even more convincing, because each candle carries a full trading session of activity rather than a few minutes of noise.
The question we wanted to answer is narrow and testable: when ETH/USDT prints a bullish engulfing candle exactly at the lowest low of the last 20 bars, does the following week behave differently from an average week? Not "does the pattern exist" — it does — but "does it carry information you can act on, after you compare it with doing nothing special at all".
What Bullish engulfing candles measures
A bullish engulfing pattern is a two-candle relationship. The first candle is red: it closes below its open. The second candle is green, and its body — the distance between open and close — completely covers the body of the red candle before it. In plain words, whatever ground sellers took in the previous session, buyers took back and then some, measured body to body rather than wick to wick.
Traders read it as a shift in control. The pattern says nothing about volume, momentum, or trend by itself; it is a pure price-shape condition. That is why most textbooks add a location filter. An engulfing candle in the middle of a sideways range is noise, while the same shape at the end of a decline is supposed to mean something. The most common filters are a moving average, a support zone, or a lookback low.
We used the lookback low because it is objective and needs no judgment. Common variants use 10, 20 or 50 bars. Some traders also require the green candle to engulf the wicks, not just the body, or to close above the prior candle's high. We kept the classic body-only definition so the result describes the pattern as it is usually taught.
The test
We used Binance ETH/USDT spot candles on the 4H timeframe, from Nov 2022 to Nov 2026, which is 8803 bars. All timestamps are UTC.
The rule: a green 4H candle whose body covers the whole body of the previous red candle, printed at the lowest low of the last 20 bars. After an event, new events are ignored for 18 bars, so that one long decline producing several engulfing candles in a row cannot flood the sample with near-duplicates. That left 18 events over four years — a small sample, and we treat it as such throughout.
Outcomes were measured from the close of the signal bar to the close 1 day, 3 days and 7 days later, with 3 days as the main horizon. The baseline is simply "any bar": the same forward measurement taken from every bar in the period, which tells us how often ETH closed higher without any signal at all. That comparison matters more than the raw numbers, because in a market with a general upward drift, a pattern that is right half the time is not actually telling you anything. These figures were calculated on historical prices; they are not actual trades. No fees or slippage are included, and real execution would subtract from every column.
Results
What happened after the signal (bullish engulfing at a 20-bar low)
| After | Events | Closed higher | Median move | Middle half (25th / 75th pct) | Worst | Baseline: closed higher | Baseline: median |
|---|---|---|---|---|---|---|---|
| 1 day | 18 | 50.0% | +0.04% | -0.7% / +1.1% | -4.6% | 51.1% | +0.06% |
| 3 days | 18 | 50.0% | -0.04% | -2.5% / +2.1% | -15.8% | 51.7% | +0.14% |
| 7 days | 18 | 33.3% | -2.82% | -7.8% / +0.4% | -12.9% | 50.9% | +0.12% |
Calculated on historical prices; not actual trades. Fees and slippage not included.
The one-day column is a coin flip: 50.0% closed higher, median +0.04%, against a baseline of 51.1% and +0.06%. At three days the pattern is still 50.0% positive, but the median turns slightly negative at -0.04% while the baseline sits at 51.7% and +0.14%. At seven days the gap widens in the wrong direction: only 33.3% of signals closed higher with a median of -2.82%, while the baseline over the same horizon was 50.9% and +0.12%.
So the honest reading is that this filter did not find bottoms. It found bars that behaved slightly worse than a randomly chosen bar, and the longer we waited, the worse the comparison looked. With 18 events, a one-week share of 33.3% could easily shift with a handful of extra samples, so we would not claim the pattern is reliably bearish either. What we can say is that there is no evidence here of the reversal edge the pattern is supposed to deliver.
The path inside the main horizon is also worth noting. The median worst dip after a signal was -2.59%, and 27.8% of events dipped more than 5% before the three days were up, while the median best rise was +2.63%. A trader placing a tight stop just under the signal candle would have been taken out often, even on events that eventually finished flat.
By year (move after 3 days)
| Year | Events | Closed higher | Median move |
|---|---|---|---|
| 2023 | 5 | 40.0% | -0.34% |
| 2024 | 3 | 66.7% | +1.28% |
| 2025 | 7 | 42.9% | -0.83% |
| 2026 | 3 | 66.7% | +0.61% |
Calculated on historical prices; not actual trades. Fees and slippage not included.
By year the picture is thin but consistent with the overall result: no year carries the sample. 2023 and 2025 produced negative medians with 5 and 7 events, 2024 and 2026 produced positive medians with 3 events each. These are tiny buckets, and the main value of the table is to show that one unusual year is not hiding a real edge in the others.
Where it failed
The worst case was 2025-10-08 04:00 UTC, with ETH near 4,463. Three days later the move was -15.8%, and the deepest point inside that window was -23.0%. The engulfing candle appeared at a 20-bar low during a period that turned into a much larger slide, and the pattern simply marked an early stage of it.
The second and third worst are smaller but similar in character: 2024-01-19 16:00 UTC near 2,493, which gave -6.9% with a -7.5% dip, and 2023-04-18 00:00 UTC near 2,080, which gave -6.4% with a -7.9% dip. In all three, the signal came while price was still making lower lows on a larger scale. The pattern's own definition places the signal at a new low, so it tends to fire exactly when a downtrend is accelerating.
For balance, the best case was 2023-02-13 16:00 UTC near 1,491, which returned +14.8% with a worst dip of only -0.6%, followed by 2025-06-01 12:00 UTC near 2,523 at +5.7%. The successes were clean and the failures were deep — that asymmetry is what drags the mean below the median at the three-day and seven-day horizons.
How to read it on your chart
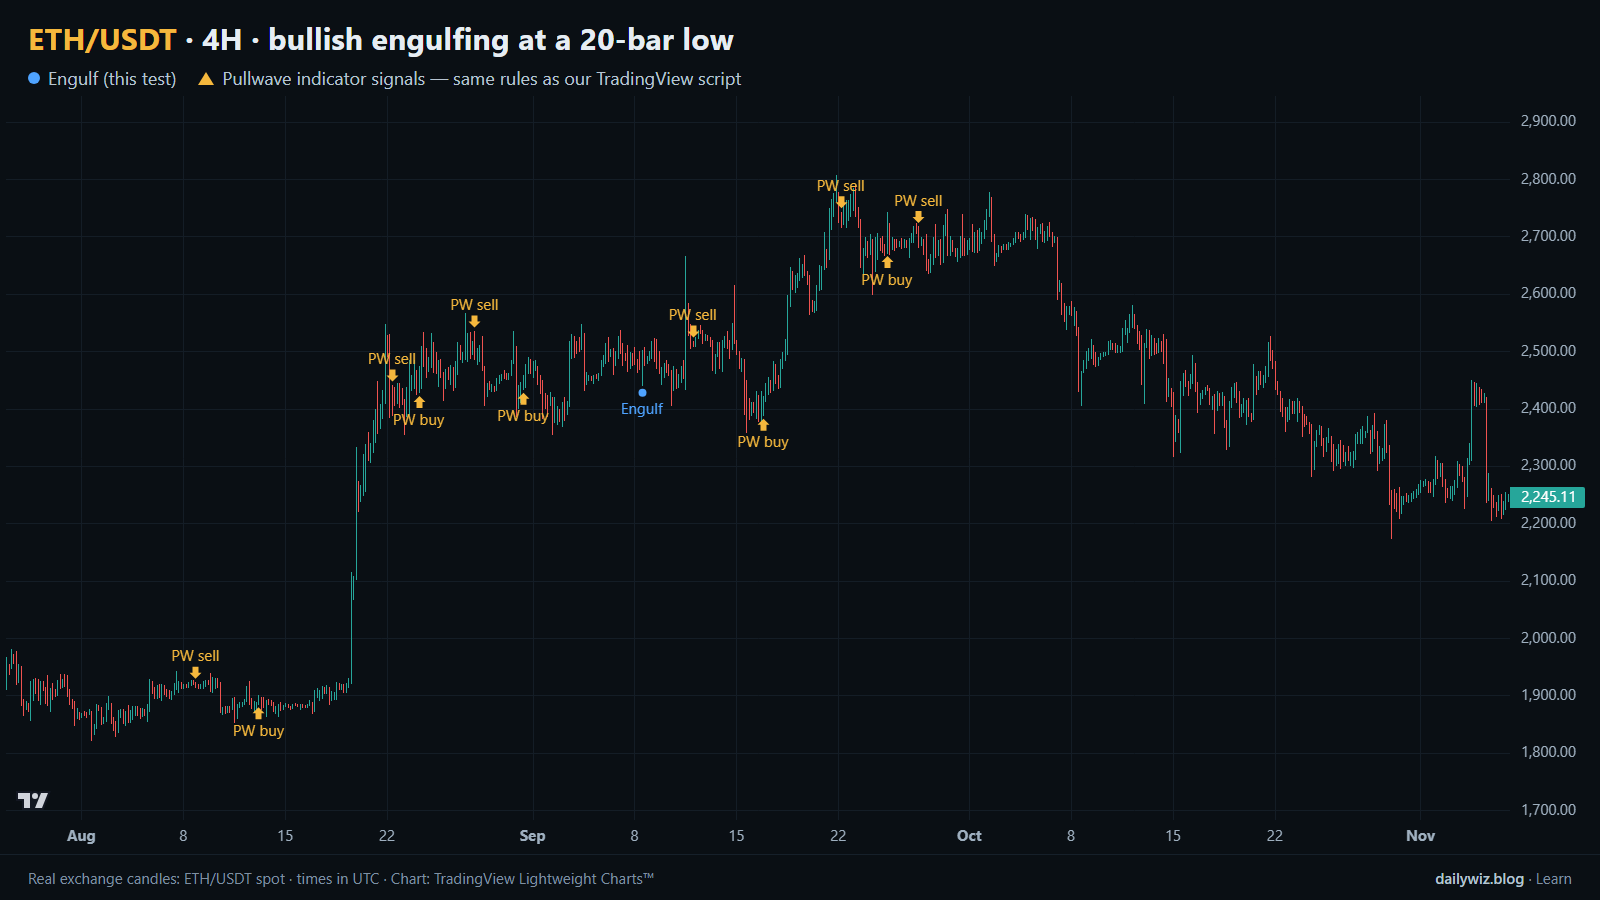
On the chart above, the blue dots mark the tested events. The first thing to notice is how rare they are: a strict definition plus the cooldown leaves long stretches with nothing. Rarity is not the same as quality, as the results show.
If you use this pattern, consider treating it as a location marker rather than a trigger. Before trusting it, check what the larger structure is doing: whether the 20-bar low is part of a shallow pullback inside an uptrend or a fresh leg of a sustained decline, since the test suggests the latter is where the damage happens. Check whether the candle closes back above a level that was support before, and whether the next bar confirms instead of immediately giving the body back.
What invalidates it is straightforward: a close below the low of the engulfing candle. Given that the median worst dip was -2.59% and 27.8% of events dipped more than 5%, a stop placed a few ticks under that low will be hit frequently, and widening it changes the risk you are actually taking. Recent events show both outcomes — 2025-10-30 20:00 UTC gave +2.7% with almost no drawdown, while 2026-02-10 12:00 UTC finished at +0.6% only after dipping -6.2%.
How the Pullwave indicator approaches this
Pullwave is an invite-only TradingView indicator built on fixed, rule-based conditions over price and volume, with no discretion in how the marks are placed. Its rules are not published, it does not predict the future, and it has losing trades. On the chart above, the gold arrows are Pullwave's marks on exactly the same candles, taken from its public record, so you can compare them directly with the blue dots of the tested pattern.
The comparison is the point, not the performance. The tested pattern is a single condition: a shape, at a low. It answers only one question, which is when something interesting might be happening. Pullwave marks long and short entries, add-ons, partial exits and exits, and it can send an alert when a mark prints, while the trader places any orders themselves. That difference is the lesson a reader can take away here: a single-condition trigger is noisy on its own, and a complete rule set also has to answer when to add, when to take partial profit and when to leave.
Key takeaways
- On ETH/USDT 4H from Nov 2022 to Nov 2026, a bullish engulfing candle at a 20-bar low produced 18 events, and 50.0% closed higher after 3 days against a 51.7% baseline.
- The seven-day horizon was weaker still, at 33.3% higher with a median of -2.82%, so waiting longer did not improve the pattern in this sample.
- The path was rough: the median worst dip inside the main horizon was -2.59%, and 27.8% of events dipped more than 5%.
- Failures clustered in accelerating declines, including 2025-10-08 04:00 UTC at -15.8%; the pattern fires at new lows by construction, which is both its appeal and its weakness.
- If you use it, consider it a place to start looking rather than a signal in itself, and combine it with trend context and a defined invalidation level.
The gold arrows on the chart are marks from the Pullwave indicator for TradingView. See how the Pullwave indicator works on pullwave.net.
Chart rendered with TradingView Lightweight Charts™ from real exchange candles. tradingview.com