Bearish MACD Crossovers on SOL 4H: Does the Downside Follow?
We tested 374 bearish MACD crossovers on SOLUSDT 4H candles. Three days later, 51.7% of bars closed higher against a 49.9% baseline, so the signal was not reliably bearish.
- Market
- SOLUSDT perpetual futures
- Timeframe
- 4H
- Data
- Sep 2020 – Nov 2026
- Sample
- 374 events
A bearish MACD crossover is one of the first signals most traders learn. The momentum line slips under its signal line, the histogram flips negative, and the chart looks like it is rolling over. On a fast market like SOL, that picture shows up often, and it is tempting to treat it as a warning that a drop is coming.
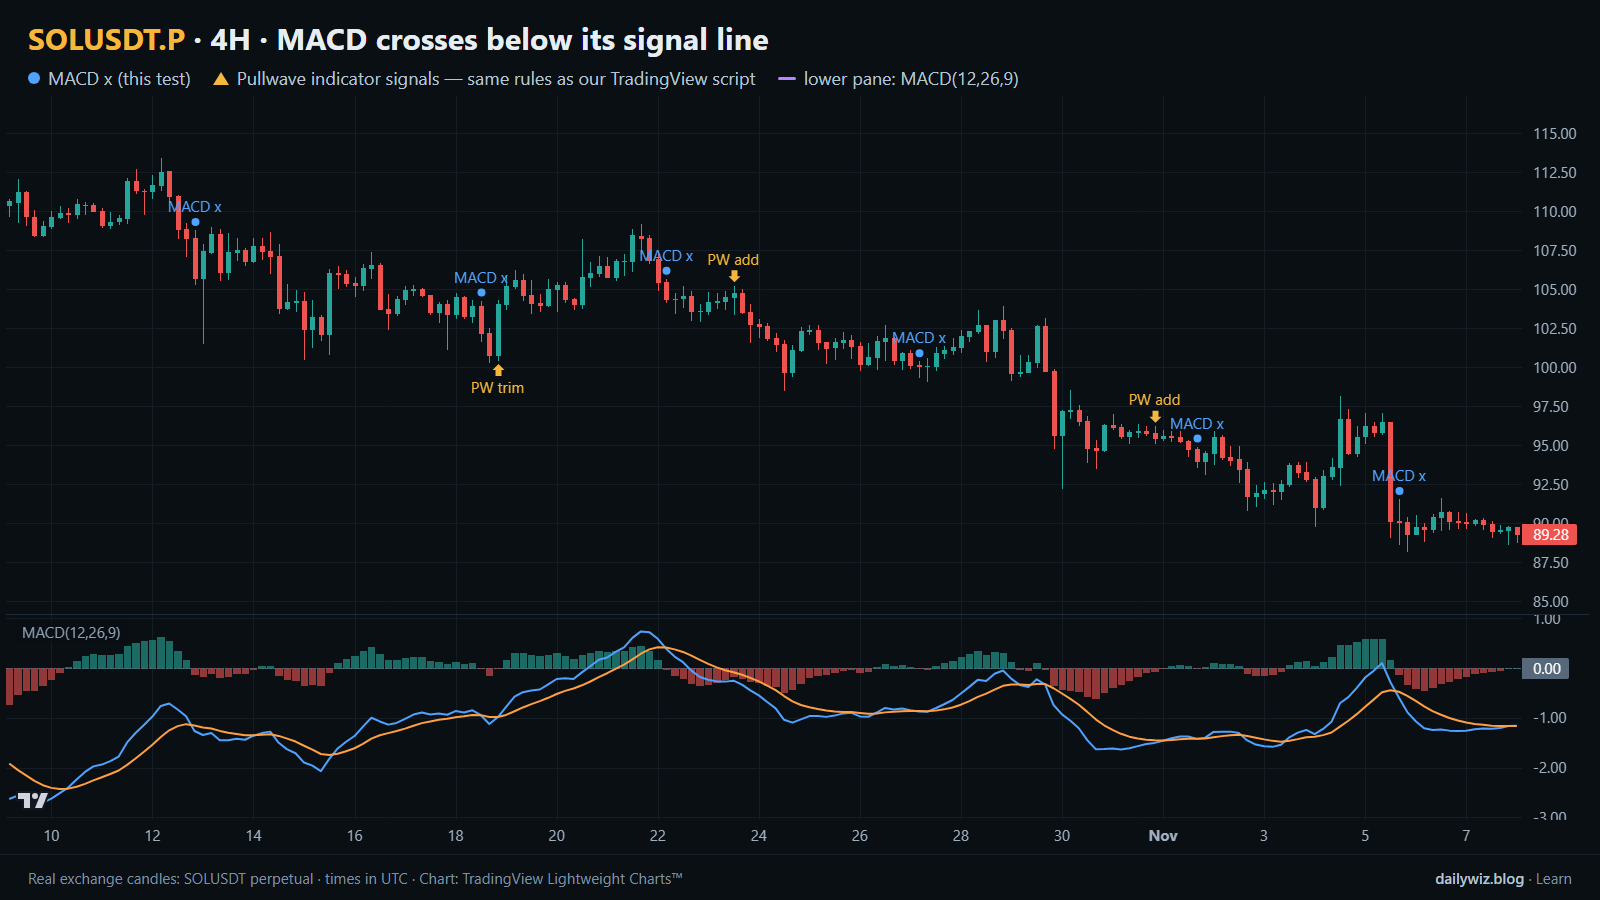
The question we wanted to answer is simple: when the MACD line crosses below its signal line on a closed 4-hour SOL candle, does the downside actually follow through? Not sometimes, not in the examples that get screenshotted, but on average across every occurrence in the data we have. The chart above shows the recent window, with blue dots on each tested crossover and the MACD pane underneath.
What Bearish MACD crossovers measures
MACD stands for moving average convergence divergence, and despite the name it is a very plain calculation. You take two exponential moving averages of the closing price, a faster one and a slower one, and subtract the slow from the fast. The default settings are 12 and 26 periods. That difference is the MACD line, and it measures whether short-term average price is pulling away from longer-term average price, and in which direction.
The MACD line is then smoothed again with a 9-period exponential average, producing the signal line. A bearish crossover happens when the MACD line falls below the signal line. In words, it means the recent rate of improvement in price has slowed down enough that it is now below its own recent average. The histogram many platforms draw is just the gap between the two lines, so a bearish crossover is the moment the histogram crosses from positive to negative.
The usual reading is that upward momentum is fading and a pullback or trend change may follow. A common refinement is to pay attention to where the crossover happens relative to the zero line: below zero is often read as a continuation of weakness, above zero as a first crack in an uptrend. We tested both readings separately.
The test
We used Binance USDⓈ-M perpetual SOLUSDT candles on the 4H timeframe, from Sep 2020 to Nov 2026, which is 13475 bars. All timestamps are UTC.
The rule was mechanical. On a closed 4H bar, the MACD line (12, 26) must cross below its 9-period signal line. To stop a single choppy stretch from flooding the sample with near-identical events, we applied a cooldown of 18 bars, so a new signal could only be counted once that window had passed. That left 374 events.
Outcomes were measured from the close of the signal bar to the close 1 day, 3 days and 7 days later. We treat 3 days as the main horizon. For each horizon we recorded how often price closed higher, the median move, the middle half of the distribution, and the extremes. We also tracked the path inside the 3-day window, not just the endpoint, because a signal can end flat after a deep dip.
The baseline is the same measurement taken from any bar in the same period, with no condition at all. That is the number the signal has to beat to be worth anything. These figures were calculated on historical prices; they are not actual trades. No fees, funding or slippage are included, and a real position would pay all three.
Results
What happened after the signal (MACD crosses below its signal line)
| After | Events | Closed higher | Median move | Middle half (25th / 75th pct) | Worst | Baseline: closed higher | Baseline: median |
|---|---|---|---|---|---|---|---|
| 1 day | 374 | 48.7% | -0.18% | -2.6% / +2.5% | -28.6% | 49.5% | -0.05% |
| 3 days | 373 | 51.7% | +0.16% | -4.9% / +5.6% | -65.6% | 49.9% | -0.01% |
| 7 days | 372 | 50.3% | +0.14% | -6.5% / +9.5% | -59.1% | 50.0% | +0.01% |
Calculated on historical prices; not actual trades. Fees and slippage not included.
The headline is that the downside did not follow through. Three days after a bearish crossover, 51.7% of events closed higher, against a baseline of 49.9%. The median move was +0.16% versus a baseline median of -0.01%. That is the opposite sign of what the signal's name suggests, and the gap is small enough that it should be read as noise rather than as a bullish edge.
The 1-day row is the only one that leans the expected way: 48.7% closed higher against a 49.5% baseline, with a median of -0.18%. That is a very thin tilt, visible only in aggregate, and it disappears by day three. At 7 days, 50.3% closed higher against a baseline of 50.0%, which is as close to no information as a sample can get.
The spread matters more than the center. The middle half of 3-day outcomes ran from -4.9% to +5.6%, the best was +56.7% and the worst -65.6%. Inside the 3-day window the median worst dip was -5.10%, and 51.9% of events dipped more than 5% at some point. But the median best rise inside the same window was +4.71%. Both sides of the path were roughly comparable, which is another way of saying the crossover marked volatility, not direction.
By year (move after 3 days)
| Year | Events | Closed higher | Median move |
|---|---|---|---|
| 2020 | 12 | 33.3% | -4.78% |
| 2021 | 61 | 68.9% | +4.79% |
| 2022 | 63 | 42.9% | -0.98% |
| 2023 | 58 | 48.3% | -0.18% |
| 2024 | 67 | 47.8% | -1.04% |
| 2025 | 59 | 50.8% | +0.16% |
| 2026 | 53 | 56.6% | +0.77% |
Calculated on historical prices; not actual trades. Fees and slippage not included.
The yearly breakdown shows where the mixed average comes from. In 2021, 68.9% of crossovers closed higher after 3 days with a median of +4.79%; in 2022 and 2024 the medians were -0.98% and -1.04%. The signal did not change across those years, the market did. A bearish crossover inside a strong uptrend was usually just a pause.
Split: MACD line below vs above zero (move after 3 days)
| Group | Events | Closed higher | Median move | Worst |
|---|---|---|---|---|
| MACD line below zero | 141 | 49.6% | -0.06% | -26.5% |
| MACD line above zero | 232 | 53.0% | +0.26% | -65.6% |
Calculated on historical prices; not actual trades. Fees and slippage not included.
The zero-line split is the refinement most traders apply, and it did not rescue the signal. Crossovers with the MACD line below zero, 141 events, closed higher 49.6% of the time with a median of -0.06%, essentially the baseline. Crossovers above zero, 232 events, closed higher 53.0% of the time with a median of +0.26%, yet that group also contained the single worst outcome at -65.6%. So the group that looked statistically friendlier was the one carrying the fattest tail.
Where it failed
The worst case was 2022-11-06 16:00 UTC, with SOL at 34.17. Three days later the move was -65.6%, with a worst dip of -71.7%. That is the FTX collapse of November 2022, an event with direct consequences for SOL. The crossover printed before the fall, but nothing in the indicator sized that outcome; it was the same dot as any other.
Two more large losses: 2022-06-10 12:00 UTC at 37.94, -26.5% with a -31.5% dip, during a broad market unwind, and 2021-02-25 12:00 UTC at 16.14, -28.5%. Those are failures only for someone holding long through a signal that was, in fact, correct.
The failures that matter more for a bearish reading are the opposite ones. On 2021-02-21 00:00 UTC at 10.24 the next 3 days returned +56.7%, and on 2021-01-05 12:00 UTC at 2.17, +52.9%. In both cases the crossover appeared mid-uptrend and price simply continued. Recent events are more ordinary: +6.1%, -2.7%, -2.8% and +0.6% on the four most recent dates, with dips between -1.8% and -7.8%.
How to read it on your chart
If you use this signal, the test suggests treating it as a timing marker rather than a direction call. Before trusting it, check the context the crossover sits in: a cross that happens while price is still making higher highs behaved very differently in 2021 than the same cross in 2022, and the indicator itself cannot tell you which regime you are in.
On the chart above, look at the blue dots in sequence. Several of them land inside the same move, and the ones that produced the sharpest follow-through look identical to the ones that produced nothing. That visual sameness is the core problem. What would invalidate the reading is simple price evidence: if the bar after the cross reclaims the level the cross printed from, the momentum shift was already undone.
Practically, the distribution argues for planning around a dip of several percent even when the final outcome is flat, and for deciding in advance what exit or invalidation you accept. Given how wide the tails were, position size matters more here than entry precision.
How the Pullwave indicator approaches this
Pullwave is an invite-only TradingView indicator, and it is rule-based: fixed rules on price and volume, with no discretion. On the chart above its marks are the gold arrows, printed on the same candles as the blue dots of the crossover test, so you can compare directly where the two disagree. Those arrows come from the public record on pullwave.net, generated by the same rules as the script.
The gold arrows do more than flag a trigger. Pullwave marks long and short entries, add-ons, partial exits and exits, and it can send a TradingView alert when a mark prints. The futures version is built around SOLUSDT perpetual futures; the spot version runs on candles of major coins. Its rules are not published, it does not predict the future, and it has losing trades. The user places any orders themselves.
The general idea a reader can take from today's test is structural: a single-condition trigger, like the crossover we measured, is noisy on its own. A complete rule set also has to answer when to add, when to take partial profit and when to exit.
Key takeaways
- Across 374 bearish MACD crossovers on SOLUSDT 4H, the 3-day outcome was 51.7% higher against a 49.9% baseline, so the downside did not reliably follow.
- The only mild tilt in the expected direction was at 1 day, 48.7% higher versus a 49.5% baseline, and it faded by day three.
- The zero-line filter did not fix it: below zero matched the baseline, and above zero held the worst case at -65.6%.
- Results tracked the year more than the signal, from +4.79% median in 2021 to -1.04% in 2024, so if you use this, consider the trend context first.
- Inside the 3-day window, 51.9% of events dipped more than 5%, which argues for sizing and invalidation rules rather than confidence in direction.
The gold arrows on the chart are marks from the Pullwave indicator for TradingView. See how the Pullwave indicator works on pullwave.net.
Chart rendered with TradingView Lightweight Charts™ from real exchange candles. tradingview.com