BTC/USDT 4H: Do Green Volume Spikes Beat the Baseline? 132 Tests
We tested 132 heavy-volume green 4H candles on BTC/USDT. Three days later 54.5% closed higher with a +0.75% median, but almost all of that edge sat above the 200-bar EMA.
- Market
- BTC/USDT spot
- Timeframe
- 4H
- Data
- Nov 2022 – Nov 2026
- Sample
- 132 events
A candle with unusually heavy volume looks like information. Someone did something large enough to show up on the tape, and the body of the candle tells you which side was in a hurry. The common belief is that a heavy-volume green candle is buyers taking control, and that price tends to follow for a while afterwards. The equally common counter-belief is that heavy volume marks exhaustion, and that the move is already over by the time you see it.
Both stories cannot be true at the same time, so today we counted. The question for this article is narrow and testable: on BTC/USDT 4H candles, when volume explodes above its recent average on a green candle, what actually happened over the following days, and was it any different from a randomly chosen bar in the same period?
What Volume spikes with direction measures
A volume spike filter has two parts. The first part is the spike itself: you take the volume of the current bar and compare it with an average of recent volume, most often a 20-bar simple average, and you require a multiple. Common thresholds are 2 or 2.5 or 3 times the average. Using a ratio instead of a fixed number of coins matters, because raw volume drifts over the years while a ratio stays comparable across a long test period.
The second part is direction. Volume alone is neutral — it tells you how much changed hands, not who was more urgent. So the usual approach is to split spikes by the candle body: a green candle means the close is above the open, a red candle means the close is below it. The spike is then read as participation that came in with a side attached.
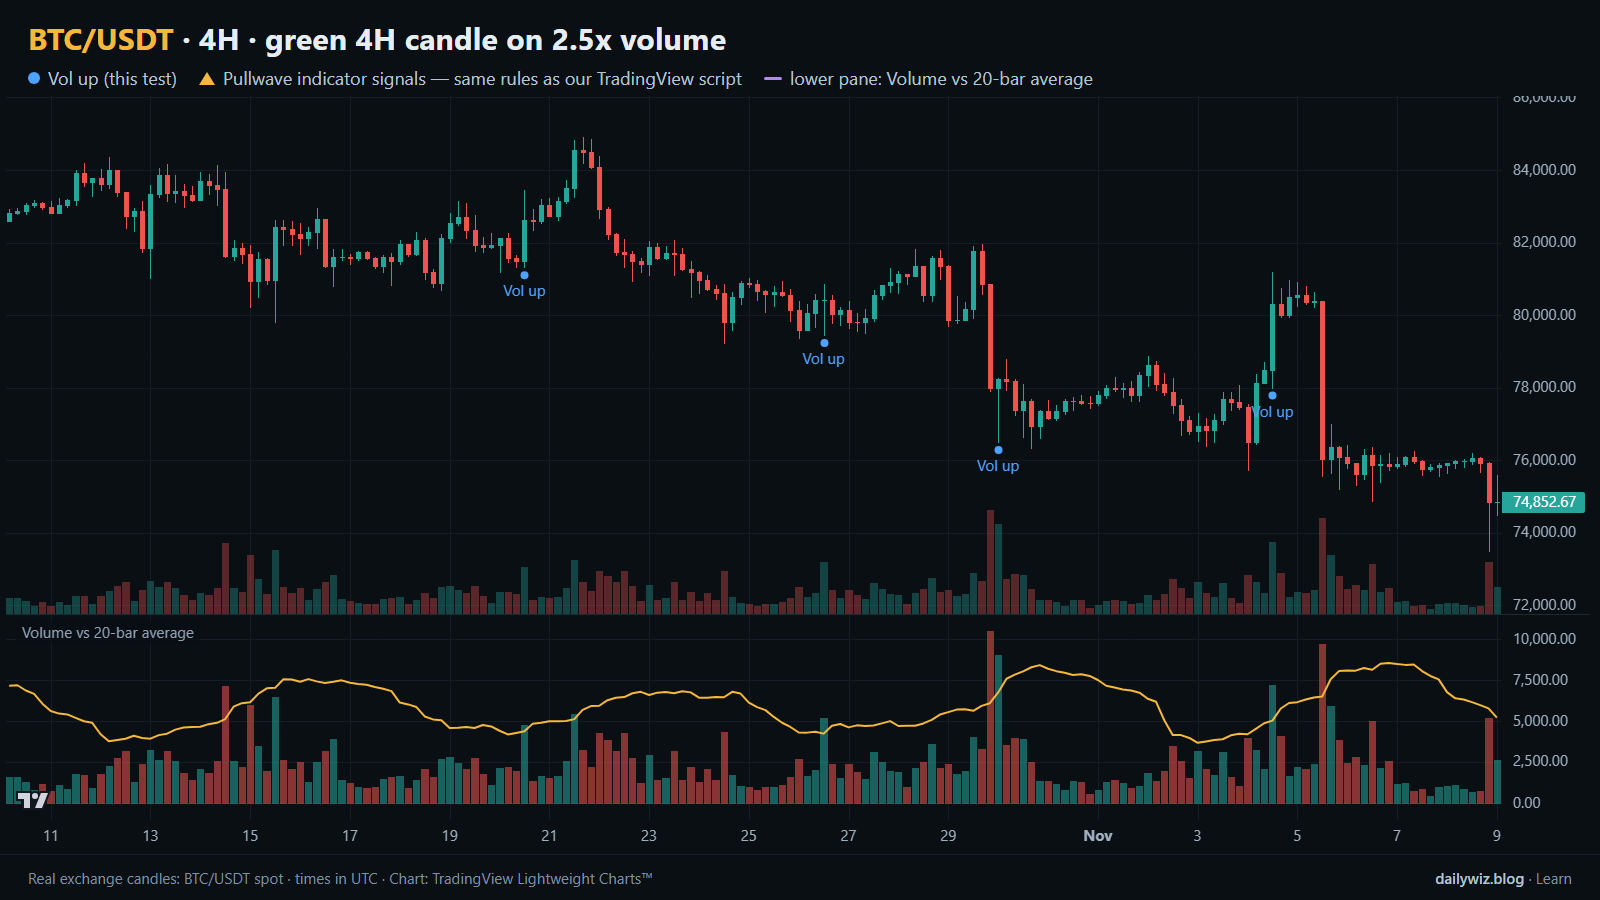
Traders usually read these bars as confirmation rather than as a standalone trigger: a spike in the direction of an existing trend is treated as continuation, a spike against it is treated as a warning or a possible exhaustion point. The lower pane on the chart above shows exactly this comparison — volume against its 20-bar average — so you can see how rare a real spike is.
The test
The data is Binance BTC/USDT spot candles on the 4H timeframe, from Nov 2022 to Nov 2026, which is 8815 bars. All timestamps are UTC.
The rule: a signal prints when 4H volume is above 2.5 times its 20-bar average and the candle is green (close above open). After a signal we applied a cooldown of 18 bars, so a cluster of spikes inside one volatile session counts once rather than ten times. That left 132 events.
Outcomes were measured from the close of the signal bar to the close 1 day, 3 days and 7 days later, with 3 days as the main horizon. As a baseline we measured the same forward moves from every bar in the same period, which tells us what a coin-flip entry would have produced in this sample. We also split the events by whether the signal bar closed above or below the 200-bar EMA, and we recorded the deepest dip and the highest rise inside the 3-day window. These figures were calculated on historical prices; they are not actual trades. No fees and no slippage are included, and a real position would pay both.
Results
What happened after the signal (green 4H candle on 2.5x volume)
| After | Events | Closed higher | Median move | Middle half (25th / 75th pct) | Worst | Baseline: closed higher | Baseline: median |
|---|---|---|---|---|---|---|---|
| 1 day | 132 | 56.1% | +0.16% | -1.3% / +1.6% | -8.5% | 52.0% | +0.06% |
| 3 days | 132 | 54.5% | +0.75% | -2.3% / +3.4% | -12.7% | 52.6% | +0.17% |
| 7 days | 131 | 51.9% | +0.15% | -3.6% / +3.4% | -14.3% | 52.8% | +0.30% |
Calculated on historical prices; not actual trades. Fees and slippage not included.
The one-day row is the strongest: 56.1% of events closed higher against a 52.0% baseline, with a median of +0.16% against +0.06%. Over 3 days the share of winners falls to 54.5%, but the median rises to +0.75% versus a baseline median of +0.17% — the edge is modest and it comes from size, not from frequency. By 7 days it is gone: 51.9% closed higher against a baseline of 52.8%, and the median of +0.15% is below the baseline's +0.30%. Whatever the spike carries, it decays.
The path matters as much as the destination. Inside the 3-day window the median worst dip was -2.22%, the median best rise was +2.78%, and 18.9% of events dipped more than 5% before the window closed. The middle half of 3-day outcomes ran from -2.3% to +3.4%. In other words, a typical signal spent part of its life underwater, and roughly one in five would have tested a wide stop.
By year (move after 3 days)
| Year | Events | Closed higher | Median move |
|---|---|---|---|
| 2022 | 1 | 0.0% | -4.40% |
| 2023 | 33 | 57.6% | +0.99% |
| 2024 | 32 | 62.5% | +2.49% |
| 2025 | 35 | 42.9% | -0.43% |
| 2026 | 31 | 58.1% | +0.87% |
Calculated on historical prices; not actual trades. Fees and slippage not included.
The yearly table shows how unstable a 132-event sample is. 2024 produced 32 events with 62.5% closing higher and a +2.49% median; 2025 produced 35 events with 42.9% closing higher and a -0.43% median. 2022 contains a single event and should be read as noise. A technique that flips from clearly positive to clearly negative between two adjacent years is not something to size aggressively around.
Split: close above vs below the 200-bar EMA (move after 3 days)
| Group | Events | Closed higher | Median move | Worst |
|---|---|---|---|---|
| Close above EMA 200 | 84 | 59.5% | +1.42% | -7.7% |
| Close below EMA 200 | 48 | 45.8% | -0.27% | -12.7% |
Calculated on historical prices; not actual trades. Fees and slippage not included.
The trend split is the most useful cut in this study. Above the 200-bar EMA, 84 events closed higher 59.5% of the time with a median of +1.42% and a worst case of -7.7%. Below it, 48 events closed higher 45.8% of the time with a median of -0.27% and a worst case of -12.7%. Below the long average, a heavy green candle was close to a coin flip with a fatter left tail. The headline edge in the main table is largely the above-EMA group carrying the below-EMA group.
Where it failed
The worst case was 2025-02-25 00:00 UTC, with price at 92,154: the 3-day move was -12.7% and the deepest dip inside the window was -13.7%. There was no recovery leg to sit through — the heavy green candle was absorbed and the market kept going the other way. The second worst was 2025-01-06 12:00 UTC at 102,148, a -7.7% move with a -10.1% dip, and the third was 2023-08-29 12:00 UTC at 27,423, a -5.9% move with a -6.8% dip. All three sit in the 2025-heavy part of the sample or in a choppy summer, and the two largest came from the year where the yearly table shows only 42.9% of events closing higher.
The best cases look very different in shape. 2024-02-26 12:00 UTC at 52,842 returned +18.8% over 3 days with a worst dip of only -0.2%, and 2023-06-19 16:00 UTC at 26,682 returned +13.2% with a -0.1% dip. The winners tended to work immediately; the losers tended to go wrong immediately. That asymmetry is why the median dip number is worth knowing before you decide where a stop would sit.
How to read it on your chart
On the chart above, the blue dots mark the tested events and the lower pane shows volume against its 20-bar average, so you can judge for yourself how far above the line each spike really was. The recent sequence is a fair illustration of the middle of the distribution rather than the tails: 2026-10-20 12:00 UTC at 82,618 gave -1.1%, 2026-10-26 12:00 UTC at 80,428 gave +1.7%, 2026-10-30 00:00 UTC at 78,235 gave +0.5%, and 2026-11-04 12:00 UTC at 80,296 gave -5.7% with a -6.7% dip. Four signals, one meaningful loss, three small moves.
If you use this filter, the split suggests checking the long-term trend context first: in our sample the same trigger behaved differently above and below the 200-bar EMA. It is also worth asking what produced the volume. A spike into a level that immediately gives back its body is not the same event as a spike that holds. The 7-day row suggests the signal is not a multi-week thesis, and the -2.22% median dip suggests that a stop placed inside normal noise would often be hit before anything resolves. Treat the spike as context for a plan you already have, not as the plan itself.
How the Pullwave indicator approaches this
Pullwave is an invite-only TradingView indicator with fixed, rule-based logic on price and volume and no discretion. On the chart above, its marks are the gold arrows, drawn on the same candles as the blue dots of the technique we tested, and taken from the public record published alongside the script. In the window shown there are no gold arrows at all, which is itself the point of the comparison: a single-condition trigger fires whenever its one condition is met, while a complete rule set can stay silent.
Pullwave marks long and short entries, add-ons, partial exits and exits, and it can send a TradingView alert when a mark prints. The futures version is built around the SOLUSDT perpetual contract; the spot version runs on major coins. Its rules are not published, it does not predict the future, and it has losing trades. The user places any orders themselves — the indicator only draws marks and sends alerts. The general idea a reader can take from the comparison is that a lone trigger is noisy, and that a finished method also has to answer when to add, when to take partial profit and when to leave.
Key takeaways
- Over 132 events, a green 4H candle on 2.5 times average volume closed higher 54.5% of the time after 3 days with a +0.75% median, against a 52.6% and +0.17% baseline — a real but small edge.
- The edge decays: by 7 days the share of winners, 51.9%, was below the 52.8% baseline.
- The trend split carried the result: 59.5% and +1.42% above the 200-bar EMA versus 45.8% and -0.27% below it.
- The path is rough — a -2.22% median worst dip and 18.9% of events dipping more than 5% inside the window.
- If you use this filter, consider treating it as context alongside trend and risk rather than as a standalone signal, and remember that fees and slippage were not included here.
The gold arrows on the chart are marks from the Pullwave indicator for TradingView. See how the Pullwave indicator works on pullwave.net.
Chart rendered with TradingView Lightweight Charts™ from real exchange candles. tradingview.com