SOLUSDT: Does a Close Below the Last Swing Low Lead to More Downside?
We tested 158 mechanical breaks of the last confirmed swing low on 4H SOLUSDT. After 3 days, 48.7% of them closed higher against a 49.9% baseline — essentially no edge.
- Market
- SOLUSDT perpetual futures
- Timeframe
- 4H
- Data
- Sep 2020 – Nov 2026
- Sample
- 158 events
A break of structure is one of the most repeated ideas in trading education: as long as price keeps making higher lows, the uptrend is intact, and the moment it closes below the last swing low, something has changed. The problem is that most people draw those levels by hand, after the fact, and then remember the times it worked. We wanted to know whether a strictly mechanical version of the same idea carries any measurable information on SOLUSDT.
So we defined a swing low with a fixed rule, waited for confirmation, and counted what price did afterwards. The question is simple: after SOL closes below its last confirmed swing low while still trading near its moving average, is the next few days more likely to be red than a randomly chosen moment would be? The answer turned out to be less dramatic than the theory suggests.
What Trend structure: breaks of the last swing low measures
A swing low is a local bottom: a candle whose low is lower than the lows of the candles around it. In our version, a 4H low must be lower than the 5 bars on each side. That symmetry matters, because it means the swing low is only known 5 bars later — you cannot confirm it in real time. Anyone who marks a swing low on the live candle is using information that did not exist yet.
Once a swing low is confirmed, it becomes a reference level. The technique reads a close below that level as a break of structure: the sequence of higher lows that defined the move up has failed. Traders usually read it as a signal that the trend has shifted, or at least that the up-leg is over, and they often use it to move stops, reduce exposure, or look for continuation lower.
Common variations change the strictness of the swing definition (two or three bars on each side gives many more, noisier levels), require a close rather than a wick, or add a filter so that the break only counts when price is still inside the trend rather than already far below it. We used the strict close and a trend filter, described next.
The test
We used Binance USDⓈ-M perpetual SOLUSDT candles on the 4H timeframe, from Sep 2020 to Nov 2026, which is 13487 bars. All times are UTC.
The rule: a swing low is a 4H low lower than the 5 bars on each side, known only 5 bars later. An event is a close below the last confirmed swing low, provided the previous close was no more than 3% under the 50 EMA. That filter keeps the sample focused on breaks that happen while price is still around its trend reference, instead of counting the twentieth bar of a collapse that already broke structure days ago. After each event we applied a cooldown of 18 bars so that one long slide does not flood the sample with near-identical entries. That left 158 events.
Outcomes were measured from the close of the signal bar to the close 1 day, 3 days and 7 days later, with 3 days as the main horizon. The baseline is "any bar": the same measurement taken from every bar in the period, which tells us what an uninformative signal would have produced. We also recorded the deepest dip and the highest rise inside the main horizon. These figures were calculated on historical prices; they are not actual trades. No fees or slippage are included, and on a perpetual market funding is not included either.
Results
What happened after the signal (close below the last confirmed swing low)
| After | Events | Closed higher | Median move | Middle half (25th / 75th pct) | Worst | Baseline: closed higher | Baseline: median |
|---|---|---|---|---|---|---|---|
| 1 day | 158 | 54.4% | +0.22% | -2.3% / +3.2% | -19.5% | 49.5% | -0.05% |
| 3 days | 158 | 48.7% | -0.43% | -4.6% / +5.9% | -40.5% | 49.9% | -0.01% |
| 7 days | 158 | 50.0% | +0.08% | -6.4% / +9.7% | -52.7% | 50.0% | +0.00% |
Calculated on historical prices; not actual trades. Fees and slippage not included.
The one-day column is the only one that looks like anything. After 1 day, 54.4% of events closed higher, against a baseline of 49.5%, with a median of +0.22% versus a baseline median of -0.05%. That is a mild bounce tendency, not a continuation lower — the opposite of what the textbook reading implies.
At the main 3-day horizon the signal fades. 48.7% closed higher against a 49.9% baseline, and the median is -0.43% while the baseline median is -0.01%. With 158 events, a gap that small is well inside the range of noise. By 7 days the two are indistinguishable: 50.0% higher against 50.0%, median +0.08% against +0.00%.
What the sample does show clearly is dispersion. The middle half of 3-day outcomes runs from -4.6% to +5.9%, the best was +108.4% and the worst -40.5%. Inside the 3-day window the median worst dip was -4.98% and the median best rise was +4.98%, and 50.0% of events dipped more than 5% at some point. In other words, the break itself does not tell you direction, but it reliably tells you that a swing of several percent in both directions is likely.
By year (move after 3 days)
| Year | Events | Closed higher | Median move |
|---|---|---|---|
| 2020 | 3 | 33.3% | -2.08% |
| 2021 | 21 | 66.7% | +3.70% |
| 2022 | 19 | 26.3% | -3.41% |
| 2023 | 29 | 44.8% | -1.41% |
| 2024 | 31 | 54.8% | +2.02% |
| 2025 | 30 | 56.7% | +1.53% |
| 2026 | 25 | 40.0% | -1.15% |
Calculated on historical prices; not actual trades. Fees and slippage not included.
The yearly split explains why opinions on this technique differ so much. In 2022, 19 events produced 26.3% higher and a median of -3.41%: the break of structure worked as advertised during a bear market. In 2021, 21 events gave 66.7% higher and +3.70%, and 2024 and 2025 also lean positive. The same rule reversed sign depending on the regime, which is another way of saying it measures the market more than it measures the setup.
Where it failed
The worst case is 2022-11-07 20:00 UTC at 29.59, which lost -40.5% over three days and went -68.2% underwater at its deepest point. That is the FTX collapse, and SOL was the asset most directly exposed to it. A structure break during a solvency event is not a technical signal; it is the first bar of a repricing.
Second was 2022-01-20 20:00 UTC at 127.5, -21.8% with a -31.4% dip — the January 2022 risk-asset drawdown. Third, 2020-12-20 16:00 UTC at 1.57, -16.9% with a -18.4% dip, in the thin early history of the contract.
The failures in the other direction matter just as much for anyone treating the break as bearish. On 2021-01-06 16:00 UTC at 1.75 the three-day move was +108.4% with a worst dip of only -4.6%, and on 2023-01-11 12:00 UTC at 15.41 it was +44.9% with a -0.9% dip. Both were breaks that immediately reversed into the start of a major advance.
How to read it on your chart
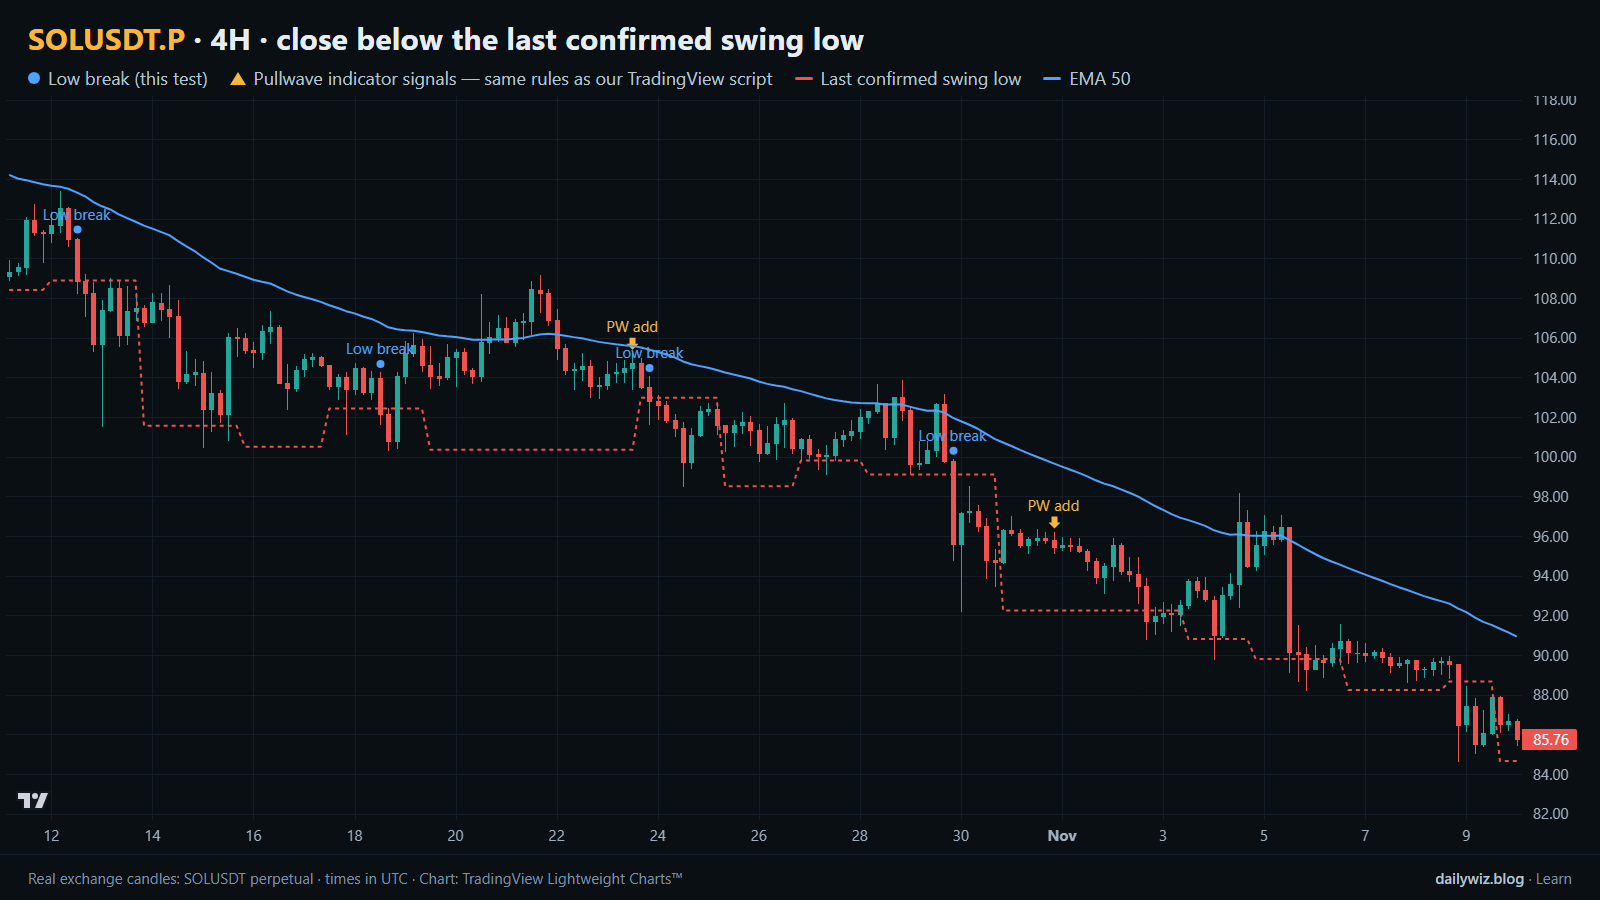
On the chart above, the blue dots mark each low break, the thin line shows the last confirmed swing low and the EMA 50 gives the trend reference. Notice how the dots cluster: four of them appear in this one window, including 2026-10-12 12:00 UTC (-2.6% after three days), 2026-10-18 12:00 UTC (+6.1%), 2026-10-23 20:00 UTC (-1.8%) and 2026-10-29 20:00 UTC (-1.2%). None of them resolved into a trend; they resolved into chop, which is what the median numbers describe.
If you use this technique, the test suggests treating the break as a risk event rather than a direction forecast. Before trusting it, consider checking whether the broader regime agrees — the yearly table shows the sign of the result follows the market cycle. Consider also what would invalidate it: a quick reclaim of the broken level within a bar or two is common, and the 1-day numbers lean that way. Because half of the events dipped more than 5% inside three days, position size and a predefined invalidation level matter more than the entry itself.
How the Pullwave indicator approaches this
Pullwave is an invite-only TradingView indicator, published at pullwave.net, and it is rule-based: fixed rules on price and volume, with no discretion left to the user. Its futures version is built around SOLUSDT perpetual futures. The rules themselves are not published, it does not predict the future, and it has losing trades like any method.
On the chart above, the gold arrows are Pullwave's marks on exactly the same candles, taken from the public record on pullwave.net, which uses the same rules as the TradingView script. Compare them with the blue dots: the dots fire on a single condition, while the arrows belong to a set that also answers when to add, when to take partial profit and when to exit. That is the general idea worth taking away from today's test — a single-condition trigger is noisy on its own, and the rest of the plan does most of the work.
Pullwave only draws marks and can send a TradingView alert when one prints. The user places any orders themselves.
Key takeaways
- A mechanical close below the last confirmed swing low on 4H SOLUSDT produced 48.7% higher closes after 3 days against a 49.9% baseline — no usable directional edge in this sample.
- The only mild tilt was at 1 day, where 54.4% closed higher versus a 49.5% baseline, which leans against the common bearish reading.
- Volatility is the reliable part: the middle half of 3-day outcomes ran -4.6% to +5.9%, and 50.0% of events dipped more than 5%.
- Results flipped by regime: 26.3% higher in 2022 versus 66.7% in 2021, so context matters more than the pattern.
- If you use structure breaks, consider them as a prompt to review risk and confirm regime, not as a standalone signal.
The gold arrows on the chart are marks from the Pullwave indicator for TradingView. See how the Pullwave indicator works on pullwave.net.
Chart rendered with TradingView Lightweight Charts™ from real exchange candles. tradingview.com