Stochastic RSI Oversold Crosses on ETH 1H: Any Edge Over Any Bar?
We counted 771 oversold Stochastic RSI crosses on ETH/USDT hourly candles. One day later, 50.8% closed higher against a 50.9% baseline for any bar — no measurable edge.
- Market
- ETH/USDT spot
- Timeframe
- 1H
- Data
- Nov 2022 – Nov 2026
- Sample
- 771 events
Open an ETH hourly chart, add a Stochastic RSI to the lower pane, and the same picture repeats: %K dives into the oversold band, flattens, curls up through %D, and then price does something. Sometimes it bounces. Sometimes it keeps falling. The oversold cross is one of the most widely shared entry triggers in crypto, partly because it prints so often that it always seems to be working somewhere on the chart.
The question here is narrow. Taken alone, with no trend filter and no confirmation, does this cross change the odds over the next few hours and days on ETH/USDT 1H candles? Or does it simply tell you that price has recently gone down? We counted every instance in our dataset and compared the outcomes with what an average bar produced.
What Stochastic RSI measures
Stochastic RSI is an oscillator applied to another oscillator. First, an ordinary RSI, usually over 14 bars, measures how much of recent movement has been upward relative to downward. Then the stochastic step asks where the current RSI value sits inside its own range over a lookback window, again usually 14 bars. If RSI sits at the bottom of its recent range, Stochastic RSI reads near the floor of its scale; at the top of that range, near the ceiling.
That raw line is jumpy, so it is smoothed twice. The notation (14, 14, 3, 3) means RSI length 14, stochastic lookback 14, a 3-bar smoothing for %K, and a 3-bar smoothing of %K to produce the %D signal line. Most traders read the lower band at 20 as oversold.
The important part is what the indicator actually measures. Because it normalizes RSI against RSI's own recent range, it is far more sensitive than plain RSI. A mild pullback that leaves RSI near the middle of its scale can still push Stochastic RSI to the floor. Oversold here does not mean selling is exhausted; it means recent momentum has been at the weak end of its own short-term range. The cross up through %D is the moment that condition begins to ease.
The test
We used Binance ETH/USDT spot candles on the 1H timeframe, 35309 bars from Nov 2022 to Nov 2026, timestamps in UTC. The rule was mechanical: Stochastic RSI (14, 14, 3, 3), %K crosses above %D while %K is below 20. The reference point is the close of the signal bar. Crosses cluster during choppy declines, so we applied a cooldown of 24 bars: the first qualifying cross counts, later ones are ignored until the cooldown expires. That left 771 events.
For each event we measured the percentage change from the close of the signal bar to the close 4 hours, 1 day and 3 days later. We also tracked the deepest dip and the highest rise inside the 1 day window, so the path is visible and not just the endpoint. The baseline is every bar in the same dataset measured the same way: pick an hour at random, hold for the same horizon, and record how often price closed higher and what the median move was. That baseline is the honest yardstick, because any long-only rule inherits whatever drift the market had.
These figures were calculated on historical prices; they are not actual trades. Fees and slippage are not included, and real execution would subtract from every number below.
Results
What happened after the signal (Stoch RSI %K crosses %D below 20)
| After | Events | Closed higher | Median move | Middle half (25th / 75th pct) | Worst | Baseline: closed higher | Baseline: median |
|---|---|---|---|---|---|---|---|
| 4 hours | 771 | 50.8% | +0.01% | -0.6% / +0.5% | -5.4% | 50.7% | +0.01% |
| 1 day | 770 | 50.8% | +0.05% | -1.5% / +1.4% | -12.7% | 50.9% | +0.04% |
| 3 days | 769 | 51.9% | +0.18% | -2.8% / +3.1% | -22.5% | 51.4% | +0.13% |
Calculated on historical prices; not actual trades. Fees and slippage not included.
The 4 hours row is the clearest statement in the study. After the cross, 50.8% of events closed higher with a median of +0.01%; after any bar, 50.7% closed higher with a median of +0.01%. That is the same picture. At 1 day the signal produced 50.8% higher closes against a baseline of 50.9%, slightly worse than doing nothing, while its median of +0.05% sat just above the baseline median of +0.04%. Over 770 events, gaps that small are noise.
At 3 days something leans the signal's way: 51.9% higher closes against 51.4%, with a median of +0.18% against +0.13%. The direction is right, but the lean is thin and the spread around it is wide. The middle half of outcomes ran from -2.8% to +3.1%, with a worst case of -22.5%.
The path matters as much as the endpoint. Inside the 1 day window the median worst dip was -1.85% and the median best rise was +1.57%, and 12.5% of events dipped more than 5% before the day ended. The typical case went underwater first.
By year (move after 1 day)
| Year | Events | Closed higher | Median move |
|---|---|---|---|
| 2022 | 30 | 46.7% | -0.09% |
| 2023 | 192 | 50.0% | -0.01% |
| 2024 | 192 | 54.2% | +0.11% |
| 2025 | 198 | 49.5% | -0.02% |
| 2026 | 158 | 50.0% | +0.02% |
Calculated on historical prices; not actual trades. Fees and slippage not included.
The yearly split shows no stable behavior. 2024 was the friendly year, with 54.2% higher closes and a median of +0.11% over 192 events. 2023 landed on 50.0% with a median of -0.01%, 2025 on 49.5% with -0.02%, and 2026 on 50.0% with +0.02%. 2022 shows 46.7%, but on 30 events, too few to read. A trigger that helps in one year and is flat in the rest is better described as regime-dependent than as an edge.
Where it failed
The worst single outcome came on 2026-06-05 at 04:00 UTC: one day later price was -12.7% lower after a -13.4% dip, with no recovery to trade around. Next was 2025-03-03 at 10:00 UTC, -11.0% after a -15.1% excursion, then 2024-04-12 at 20:00 UTC, -9.8% with a -11.6% dip.
The thread is structural. Stochastic RSI reaches oversold early in a fast decline, so the rule fires into the first hours of a liquidation move, and a cooldown of 24 bars does not prevent another entry a day deeper into the same slide. The best cases are the mirror image: 2025-05-07 at 18:00 UTC returned +14.5% with a dip of only -1.1%, and 2024-03-05 at 20:00 UTC returned +13.9% with -0.1%. When the cross worked it worked almost immediately; when it failed it was rarely in profit at all.
The recent cluster repeats the lesson in miniature: 2026-11-04 at 03:00 UTC gave +7.8%, 2026-11-05 at 06:00 UTC gave -8.3% with a -9.2% dip, and the signals at 2026-11-07 18:00 UTC and 2026-11-09 00:00 UTC gave 0.0% and -0.8%.
How to read it on your chart
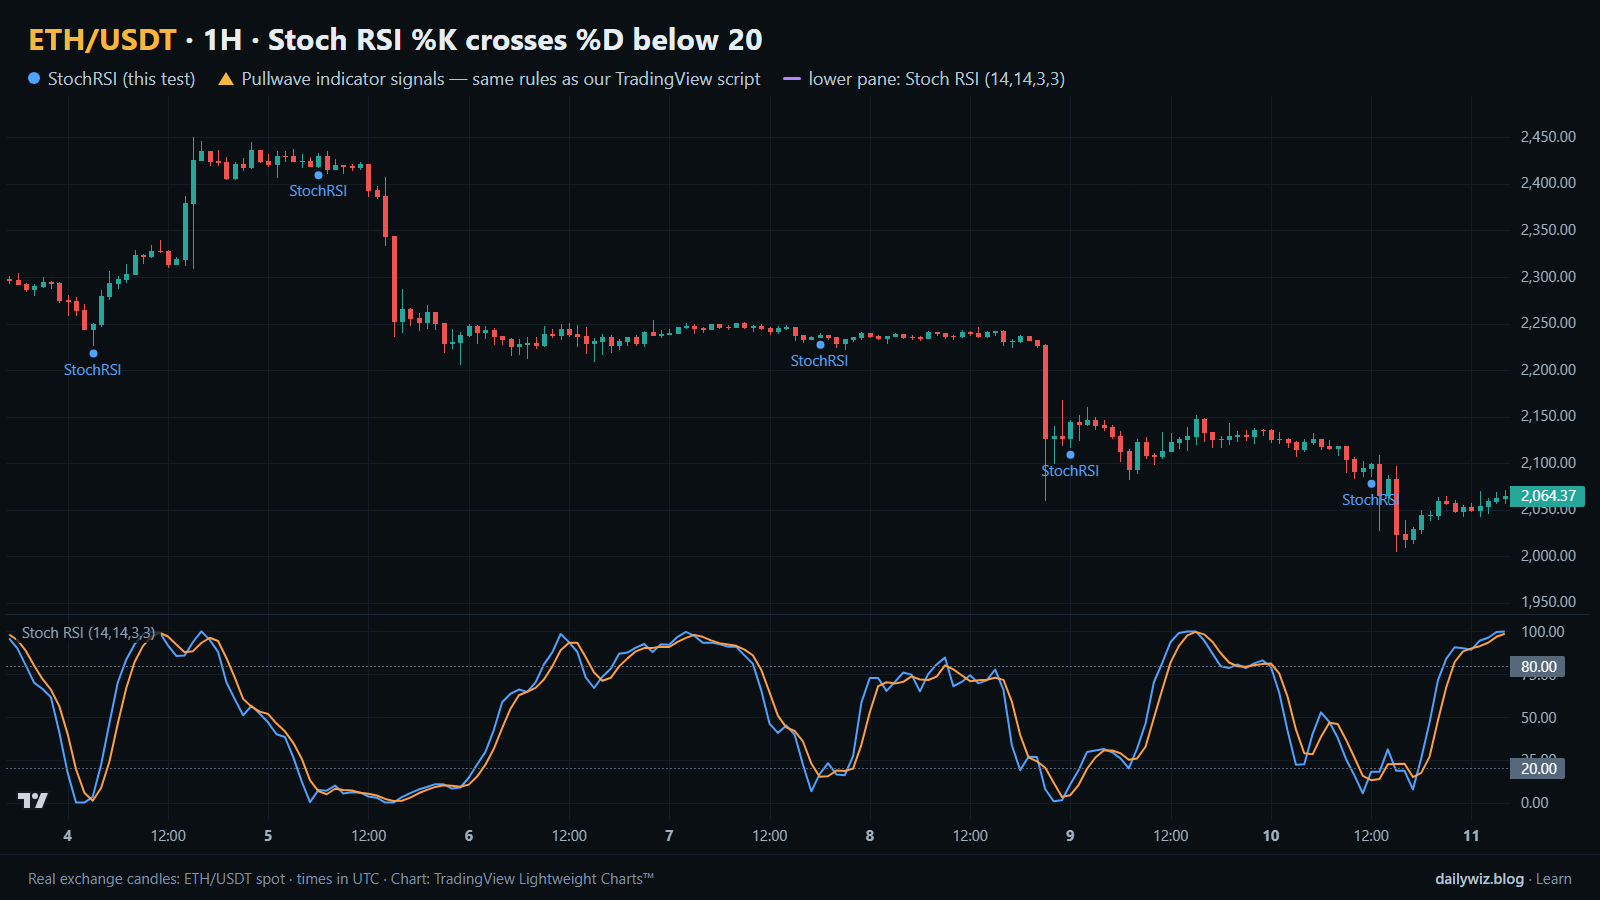
Look at the chart above. The blue dots mark every qualifying cross in the window, and the lower pane shows the oscillator that produced them. They arrive in a tight sequence through a decline, and their outcomes within a single week range from strongly positive to strongly negative. That is the texture of a single-condition trigger: frequent, timely, directionally agnostic.
If you use this reading, consider treating the cross as a timing cue rather than a reason. The test suggests the useful question is what the cross is happening inside: a pullback within an established uptrend, a range extreme, or the first leg of a vertical decline. The oscillator looks much the same in all three. The context that invalidated it fastest was successive lower hourly closes with expanding range, which is what produced every worst case above.
It is also worth sizing against the measured path. A median worst dip of -1.85% inside 1 day means a stop tighter than the typical excursion will turn many positive endpoints into losses.
How the Pullwave indicator approaches this
The gold arrows on the chart above are Pullwave's marks on the same candles as the blue dots, so you can compare how often each one chooses to speak. Pullwave is an invite-only TradingView indicator. It is rule-based: fixed rules on price and volume, no discretion. Its rules are not published. On the chart it marks long and short entries, add-ons, partial exits and exits, and it can send a TradingView alert when a mark prints. The arrows shown here come from the public record on its site, produced by the same rules as the script.
It does not predict the future and it has losing trades. The user places any orders themselves; the indicator only draws marks and sends alerts. The idea a reader can take from the comparison is structural rather than promotional: a single-condition trigger like the one tested here is noisy on its own, while a complete rule set also has to answer when to add, when to take partial profit and when to exit.
Key takeaways
- Across 771 oversold Stochastic RSI crosses on ETH/USDT 1H, the 1 day share of higher closes was 50.8% against a baseline of 50.9%, so no measurable edge at that horizon.
- The only mild lean appeared at 3 days, 51.9% against 51.4%, with a median of +0.18% against +0.13%; small enough to be erased by fees and slippage.
- The path was uncomfortable: a median worst dip of -1.85% inside 1 day, and 12.5% of events dipping more than 5%.
- Year by year the result was unstable, with 2024 at 54.2% and the other full years at or below 50.0%.
- If you use this trigger, consider it a timing cue inside a trend or range framework you have already defined, not a standalone reason to act.
The gold arrows on the chart are marks from the Pullwave indicator for TradingView. See how the Pullwave indicator works on pullwave.net.
Chart rendered with TradingView Lightweight Charts™ from real exchange candles. tradingview.com