SOL perp vs spot: what did holding the perpetual long cost?
We measured the SOL spot versus SOLUSDT perpetual price gap and the funding a long paid across 35333 hours. The median 30-day funding bill was +0.26%, the 95th percentile +1.91%.
- Market
- SOLUSDT perpetual futures
- Timeframe
- 1H
- Data
- Sep 2020 – Nov 2026
- Sample
- 35333 samples
If you want exposure to SOL you have two obvious ways to get it: hold the coin, or hold the perpetual. The price charts look almost identical, so the choice often gets treated as a matter of convenience — leverage, margin, one account instead of two. But the two instruments are not the same asset. The perpetual trades at its own price and it charges or pays a funding rate several times a day to stay tethered to spot.
The question here is narrow and practical: over the life of the SOLUSDT perpetual, what did it cost to hold the perp long instead of spot? We split that cost into two parts — the price gap at the moment you enter, and the funding you pay while you hold — and measured both on real hourly candles.
What Spot vs perpetual futures measures
Two numbers describe the relationship between a perpetual and its underlying spot market.
The first is the price gap, often called basis. It is the perpetual price divided by the spot price, minus one, expressed as a percent. A positive gap means the contract trades above spot: buyers are paying a premium for leveraged exposure. A negative gap means it trades below spot. On liquid pairs the gap is tiny, measured in hundredths of a percent, and it widens when one side of the book is crowded or liquidity thins.
The second is funding. Because a perpetual never expires, the exchange uses a periodic payment to pull the contract back toward spot. On this venue funding settles every 8 hours. When the rate is positive, longs pay shorts; when it is negative, shorts pay longs. A single print is small, but it repeats, so the number that matters to a holder is the sum over the days they intend to stay in.
Read together: the gap is the price of opening, funding is the rent of staying. Anyone comparing spot and perp is really asking whether the leverage and margin efficiency are worth that rent.
The test
Our data source is Binance USDⓈ-M perpetual SOLUSDT candles on the 1H timeframe, from Sep 2020 to Nov 2026, 53998 bars in total. All timestamps are UTC. Alongside the perpetual we used hourly SOL spot closes and the exchange's published funding history, which contributed 4492 funding prints.
The rule is as stated: at every hourly close where both series exist we computed the price gap as perp divided by spot, minus one. That gave 35333 overlapping hours. Separately, we summed the 8-hour funding rates a long would have paid over rolling windows of 7, 30 and 90 days, so each window answers the question "if a long was opened at this hour and carried, what did funding add up to?" Outcomes run from the close of the signal bar to the close of the bar at the end of the holding window.
There is no discrete trigger here and therefore no cooldown: every hour is its own observation, and the "any bar" baseline is simply the full distribution of all hours in the sample. These figures were calculated on historical prices; they are not actual trades. Fees, slippage and the spread between the two venues are not included, so the real cost of running the perp leg would be higher than what we report.
Results
What holding the perpetual instead of spot cost (median, 5th / 95th percentile)
| Measure | Median | 5th / 95th percentile |
|---|---|---|
| Perp vs spot price gap (hourly) | -0.046% | -0.094% / +0.080% |
| Funding paid by a 7-day long | +0.07% | -0.75% / +0.45% |
| Funding paid by a 30-day long | +0.26% | -1.07% / +1.91% |
| Funding paid by a 90-day long | +0.87% | -1.62% / +6.47% |
Calculated on historical prices; not actual trades. Fees and slippage not included.
The first row surprises most readers. The median hourly price gap was -0.046% — the perpetual typically closed slightly below spot, not above it. The 5th and 95th percentiles, -0.094% and +0.080%, show how tight the relationship stayed: across tens of thousands of hours the two prices almost never separated by more than a tenth of a percent at the hourly close. Entry price is not where the cost lives.
Funding is. The median 7-day bill for a long was +0.07%, close to nothing. Over 30 days the median was +0.26%, over 90 days +0.87%. Those medians describe a slow drip rather than a serious drag, and they are what a holder would experience most of the time.
The percentiles change the picture. The 95th percentile was +1.91% over 30 days and +6.47% over 90 days. A long that happened to carry through a crowded, euphoric stretch paid a cost the median hides completely. The left tail runs the other way: -0.75% over 7 days, -1.07% over 30 days and -1.62% over 90 days, meaning there were extended periods when shorts were crowded and the long side was paid to hold. Across the sample, 67.1% of funding prints were positive, so the base case for a long is paying — but far from always.
Against the "any hour" baseline, the honest reading is that the perpetual was a cheap way to hold SOL in the typical case and an expensive one in the tail. Neither the gap nor the median funding would change a trade thesis; the right tail of funding could.
Where it failed
This test produced no single catastrophic event to point at, and we will not invent one — the measurement is a distribution, not a list of trades. What it exposes is when the cost arrives rather than how large it is on average.
The damage is concentrated. With a median 90-day bill of +0.87% against a 95th percentile of +6.47%, a holder who sized a position using the median would have badly underestimated the worst stretches. Those stretches are also the ones where a long is least willing to cut exposure, since persistently positive funding is itself a symptom of a strong, crowded uptrend. Cost and conviction peak together.
The mirror image failed for anyone assuming funding is always a cost. With a 5th percentile of -1.62% over 90 days, there were long periods when the perpetual long was subsidized. A rule that always prefers spot because "longs pay funding" gave that up.
How to read it on your chart
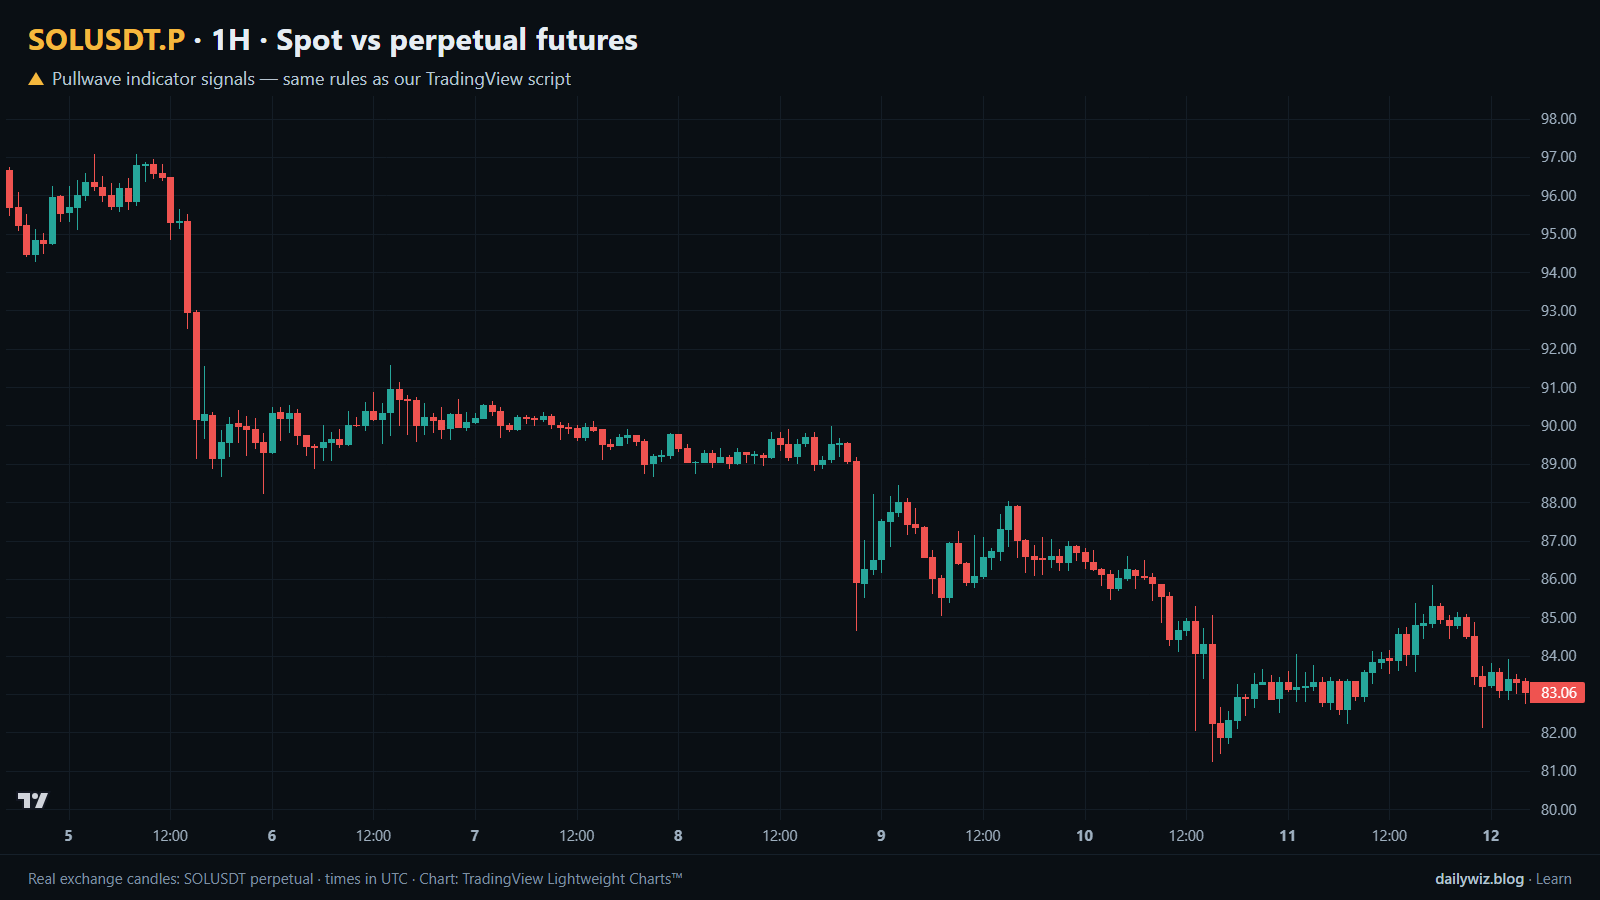
The chart above shows hourly SOLUSDT candles for the most recent window. Because this technique is a continuous cost measure rather than a trigger, there is no row of blue dots marking discrete events in that window; the gold arrows are Pullwave's marks on the same candles, shown for comparison.
If you use this, the useful habit is to check funding before choosing the instrument, not after. Look at the recent run of funding prints alongside your intended holding period. A position you expect to close inside a day is barely touched by the medians above, while one you expect to carry for a quarter sits where the tail matters. If funding has been positive for a long consecutive stretch and the gap has drifted toward the upper end of its range, the test suggests the carry cost is in its expensive regime. What invalidates the "perp is cheap" assumption is persistence, not one high print. And because the gap stayed within roughly a tenth of a percent, entry slippage between venues is a smaller consideration than the fees and carry paid over the holding period.
How the Pullwave indicator approaches this
Pullwave is an invite-only TradingView indicator. It is rule-based: fixed rules on price and volume, with no discretion. Its futures version is built around the SOLUSDT perpetual, the same contract measured here, and a spot version runs on candles of major coins. On the chart above, the gold arrows are its marks on these candles, taken from the public record on its site, which follows the same rules as the TradingView script. You can set them next to the blue dots of the tested technique and compare directly.
The rules themselves are not published, the indicator does not predict the future, and it has losing trades. It marks long and short entries, add-ons, partial exits and exits, and it can send a TradingView alert when a mark prints. The user places any orders themselves; the tool only draws and notifies.
The general idea worth taking away: a single-condition trigger, like the cost measure examined here, is noisy on its own. A complete rule set also has to answer when to add, when to take partial profit and when to exit.
Key takeaways
- The entry-side cost was small: the median hourly perp-versus-spot gap was -0.046%, with percentiles of -0.094% and +0.080%.
- Funding is the real carry. Median bills for a long were +0.07% over 7 days, +0.26% over 30 days and +0.87% over 90 days.
- The tail is what hurts: +1.91% at the 95th percentile over 30 days, +6.47% over 90 days, and 67.1% of the 4492 funding prints were positive.
- Longs were sometimes paid, with a 5th percentile of -1.62% over 90 days, so the perp did not always cost more than spot.
- If you use this, consider matching the instrument to your intended holding period, and remember fees and slippage sit on top of every figure here.
The gold arrows on the chart are marks from the Pullwave indicator for TradingView. See how the Pullwave indicator works on pullwave.net.
Chart rendered with TradingView Lightweight Charts™ from real exchange candles. tradingview.com