SOL vs BTC: Correlation 0.59, Beta 1.17 — Does SOL Just Follow?
We paired 2249 daily closes of the SOLUSDT and BTC perpetuals. Correlation was 0.59 and beta 1.17, but on days when BTC moved less than ±2%, SOL closed higher just 48.7% of the time.
- Market
- SOLUSDT perpetual futures
- Timeframe
- 1D
- Data
- Sep 2020 – Nov 2026
- Sample
- 2249 samples
Most traders feel it before they measure it: when bitcoin drops hard, solana usually drops harder. But "usually" is carrying a lot of weight in that sentence. How often is it true, how much harder, and does the link still hold on ordinary days when BTC barely moves? Those are three different questions with three different answers.
This article measures the relationship in two steps: the two classic summary numbers, correlation and beta, over the full history of the SOLUSDT perpetual, and then a breakdown of SOL's typical same-day move grouped by the size of BTC's move. The second view is usually the more useful one, because it shows where the relationship is reliable and where it quietly disappears.
What Correlation and beta measures
Correlation asks one narrow question: when one asset's daily return is above its own average, is the other one usually above its own average too? It is calculated from the daily returns of both assets over the same days — measure how far each day sits from its own mean, multiply the two deviations together, and scale the result by how volatile each series is. That scaling keeps the output between minus one and plus one. Plus one means lockstep direction, zero means no linear relationship, minus one means opposite directions.
Correlation says nothing about size; that is beta's job. Beta is the slope of the line you would draw through a scatter plot of BTC's daily return on the horizontal axis and SOL's on the vertical. A beta above one means SOL typically moved more than BTC in the same direction.
Most traders compute both over a rolling window, often a month or a quarter, and watch the line rather than one static figure. A rising correlation means the altcoin is trading as a proxy for bitcoin; a falling one means something coin-specific is in charge.
The test
We used Binance USDⓈ-M perpetual SOLUSDT candles on the 1D timeframe, from Sep 2020 to Nov 2026, 2250 bars in total, with all timestamps in UTC. For each day we took the close-to-close percentage change of the SOL perpetual and the close-to-close change of the BTC perpetual on the same UTC day, which left 2249 paired daily returns.
From that series we calculated the correlation and the beta of SOL to BTC. We then sorted every day into five buckets by BTC's move alone — fell more than 5%, fell 2–5%, moved less than ±2%, rose 2–5%, rose more than 5% — and recorded, inside each bucket, the number of days, SOL's median move, and how often SOL closed higher than the previous close.
There is no entry signal and no holding period here, so each outcome is simply the close of the day measured against the previous close. The baseline is the full sample of 2249 days before conditioning on BTC. No cooldown is needed, because each day enters the sample exactly once. These figures were calculated on historical prices; they are not actual trades. No fees, funding or slippage are included.
Results
Over the full sample the correlation was 0.59 and the beta was 1.17. A correlation of 0.59 is high enough to call BTC a major driver of SOL's daily direction, and far too low to call SOL bitcoin with a multiplier: much of SOL's daily variance is its own. The beta of 1.17 matches what most traders expect — same direction, bigger move.
The buckets sharpen the picture.
SOL on the same day, grouped by BTC's daily move
| BTC day | Days | SOL median move | SOL closed higher |
|---|---|---|---|
| BTC fell more than 5% | 88 | -8.39% | 9.1% |
| BTC fell 2–5% | 300 | -4.12% | 13.0% |
| BTC moved less than ±2% | 1434 | -0.09% | 48.7% |
| BTC rose 2–5% | 317 | +3.72% | 88.0% |
| BTC rose more than 5% | 110 | +6.75% | 84.5% |
Calculated on historical prices; not actual trades. Fees and slippage not included.
At the extremes the link is strong. On the 88 days BTC fell more than 5%, SOL's median move was -8.39% and SOL closed higher on only 9.1% of them. On the 300 days BTC fell 2–5%, the median was -4.12%, with SOL higher 13.0% of the time. The upside mirrors it: on the 317 days BTC rose 2–5%, SOL's median was +3.72% and it closed higher 88.0% of the time; on the 110 days BTC rose more than 5%, the median was +6.75% and the rate 84.5%.
The middle bucket is the largest and the most sobering. On the 1434 days BTC moved less than ±2%, SOL's median move was -0.09% and it closed higher on 48.7% of days, essentially the unconditional coin flip. The headline correlation of 0.59 is earned almost entirely on days when bitcoin moves a lot, and most days are not those days.
One asymmetry stands out: the down buckets show lower "closed higher" rates than their mirror-image up buckets, and the median magnitudes in the down buckets are larger. The test suggests the downside link is tighter than the upside link.
Where it failed
The failure here is not a single bad day; it is a whole regime. The ±2% bucket, with 1434 days in it, breaks the mental model: a median of -0.09% and 48.7% of days closing higher mean that any rule of the form "BTC is green today, so SOL should be green" has no measurable edge on calm days. A trader forming a view on SOL from a small BTC candle is reading noise.
The tails fail too, just less often. On 9.1% of the heavy BTC down days SOL still closed higher, and the 84.5% following rate on heavy up days leaves a visible minority that did not follow. Those exceptions are the days when something coin-specific dominated, and a high average correlation offers no protection on them.
How to read it on your chart
First, identify the regime before leaning on the relationship at all. If bitcoin's daily range is small, the test suggests treating SOL's direction as largely independent and looking for reasons on SOL's own chart. If bitcoin is making a large daily move, the co-movement evidence is much stronger, and sizing matters more than the direction call, because a beta of 1.17 means the move landing on your side of the book is typically larger than the one you see on BTC.
Second, remember what correlation cannot do. It does not tell you the order of events, it does not survive a protocol-specific headline, and it is not stable across years. If you track it, track it as a rolling line.
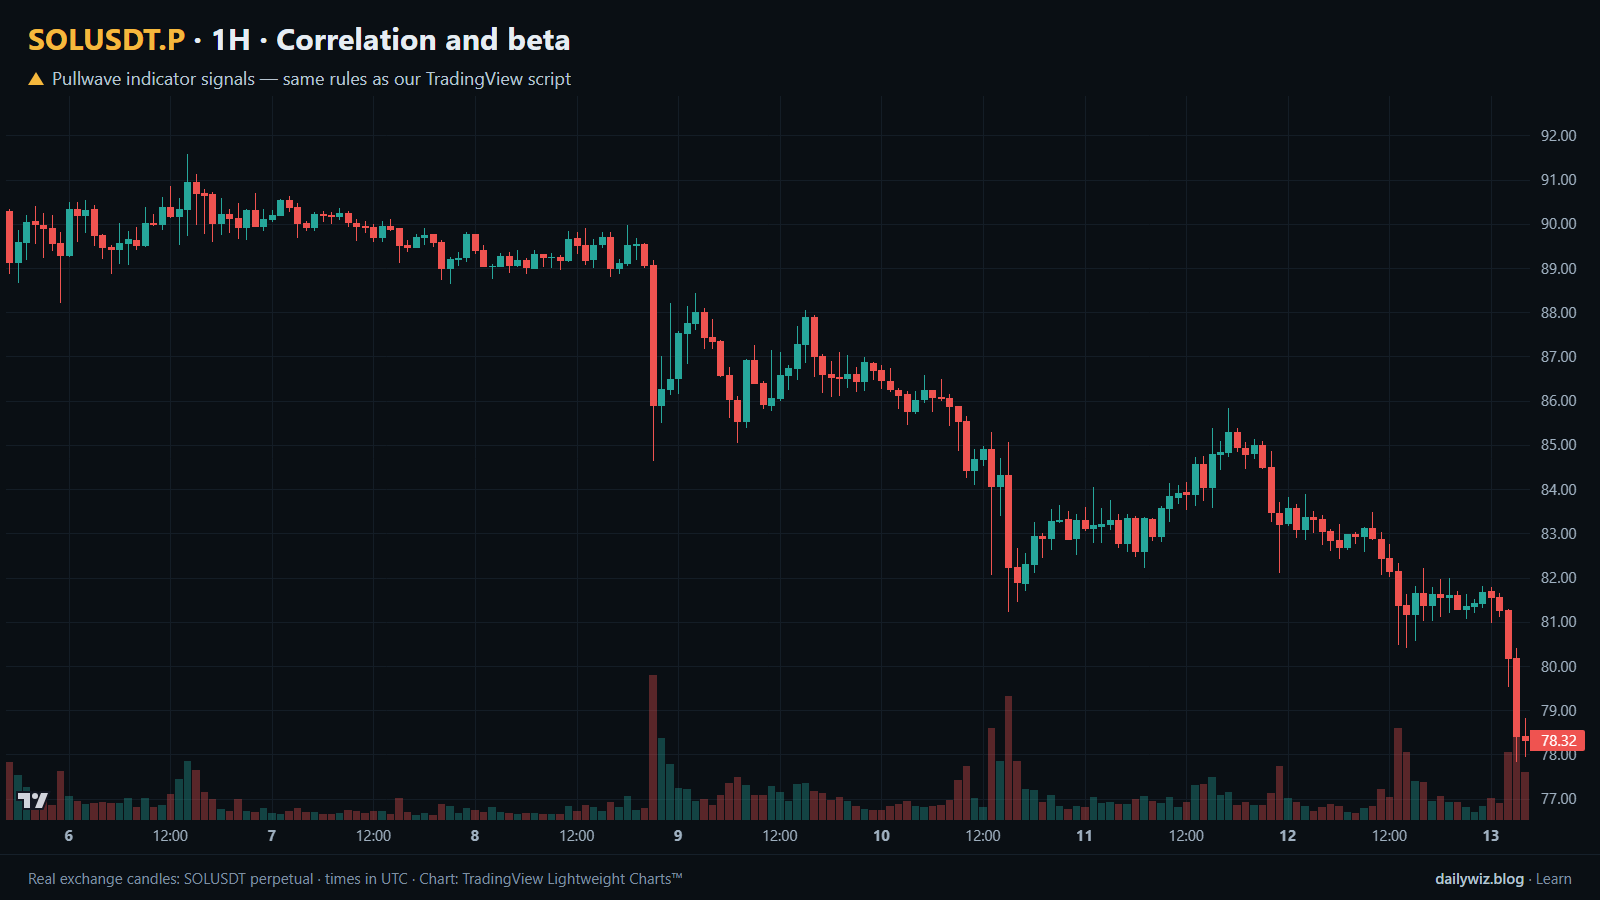
On the chart above, the window is a short stretch of hourly candles rather than the daily series we measured, so no blue event dots appear in it; this study has no per-bar trigger to plot. Use the chart instead to see how the same candles are marked by a complete rule set.
How the Pullwave indicator approaches this
Pullwave is an invite-only TradingView indicator, and it is rule-based: fixed rules on price and volume, no discretion. On the chart above, the gold arrows are its marks on the same candles, taken from the public record on its site and generated by the same rules as the TradingView script. Where the blue dots of a tested technique show a single condition firing, the gold arrows come from a rule set that also has to answer what happens after an entry: when to add, when to take a partial exit, and when to close. The futures version is built around SOLUSDT perpetual futures; the spot version runs on major coins. Its rules are not published, it does not predict the future, and it has losing trades. The indicator only draws marks and can send a TradingView alert when a mark prints; the user places any orders. The general idea worth keeping is the one this article keeps meeting: a single-condition trigger, such as "bitcoin is up today," is noisy on its own.
Key takeaways
- Across 2249 paired daily closes, correlation was 0.59 and beta was 1.17: SOL usually follows BTC's direction and usually moves more, though much of its variance is its own.
- The relationship lives in the tails. On the 1434 days BTC moved less than ±2%, SOL closed higher 48.7% of the time, no better than a coin flip.
- The downside link looked tighter: 9.1% of days closed higher when BTC fell more than 5%, against 84.5% higher when BTC rose more than 5%.
- If you use correlation and beta, consider treating them as rolling regime descriptions rather than fixed properties of the pair.
- No costs are included here, and a measurement of co-movement is not a trading rule on its own.
The gold arrows on the chart are marks from the Pullwave indicator for TradingView. See how the Pullwave indicator works on pullwave.net.
Chart rendered with TradingView Lightweight Charts™ from real exchange candles. tradingview.com