SOL after an 8% day: 105 cases of momentum, but a thin edge
We tested every daily close at least 8% above the previous close on SOLUSDT perpetual futures. Three days later 54.3% closed higher versus a 50.0% baseline, and the split by the 200-day EMA did most of the work.
- Market
- SOLUSDT perpetual futures
- Timeframe
- 1D
- Data
- Sep 2020 – Nov 2026
- Sample
- 105 events
A daily candle that closes far above the previous one forces a decision. Some traders read it as proof that buyers have taken control and that the move has further to run. Others read it as exhaustion: the easy part is over, and what comes next is a give-back. Both stories sound reasonable, and both are told with confidence after the fact.
So we counted. The question for today is narrow and testable: after SOLUSDT closes a day at least 8% above the previous daily close, does price tend to keep going, or does it hand the gain back? We measured what happened one, three and seven days later on real exchange candles, and compared it with what an ordinary day in the same market produced.
What Momentum vs mean reversion after big days measures
The technique is one of the simplest event studies in trading. You take each daily close, compare it with the previous daily close, and express the difference as a percentage. When that percentage crosses a threshold you decide in advance, the day is flagged as an event. Then you look forward a fixed number of bars and record how price closed relative to the event close. Nothing is fitted, nothing is optimized after the fact.
The threshold matters. Set it too low and almost every week produces an event, which tells you little. Set it too high and you end up with a handful of cases and no usable sample. For a high-volatility asset, a threshold of 8% in a single UTC day is rare enough to mean something and common enough to measure.
Two more settings shape the result. A cooldown prevents a cluster of consecutive explosive days from being counted as several independent observations. And a trend filter — here the 200-day EMA, an exponential moving average of the last 200 daily closes — splits events into those that happen inside an uptrend and those that happen inside a downtrend. Traders usually read the output as a probability statement, not a trade: of all the times this happened before, how often did price continue, and by how much.
The test
We used Binance USDⓈ-M perpetual SOLUSDT candles, timeframe 1D, all timestamps in UTC, from Sep 2020 to Nov 2026. That is 2251 daily bars.
The rule: flag any daily close at least 8% above the previous daily close. After an event, we applied a cooldown of 3 days, so overlapping bursts do not inflate the sample. That left 105 events.
Outcomes were measured from the close of the signal bar to the close 1 day, 3 days and 7 days later. Our main horizon is 3 days. For context, we also measured the baseline: the same forward returns starting from any bar in the same period, not just event bars. Without a baseline, a share of winners near half looks like information when it may be nothing more than the market's natural drift. These figures were calculated on historical prices; they are not actual trades. No fees, funding or slippage are included, and a real position would pay all three.
Results
What happened after the signal (daily gain of 8% or more)
| After | Events | Closed higher | Median move | Middle half (25th / 75th pct) | Worst | Baseline: closed higher | Baseline: median |
|---|---|---|---|---|---|---|---|
| 1 day | 105 | 55.2% | +0.97% | -3.6% / +4.5% | -37.5% | 49.7% | -0.03% |
| 3 days | 105 | 54.3% | +2.07% | -4.2% / +8.8% | -30.4% | 50.0% | -0.00% |
| 7 days | 105 | 53.3% | +1.55% | -7.4% / +11.7% | -51.3% | 49.3% | -0.29% |
Calculated on historical prices; not actual trades. Fees and slippage not included.
The direction is consistent across all three horizons: after a big up day, price closed higher slightly more often than after an ordinary bar. At 3 days, 54.3% of events closed higher against a baseline of 50.0%, with a median of +2.07% against a baseline median of -0.00%. At 1 day the share was 55.2% against 49.7%. At 7 days it was 53.3% against 49.3%.
So momentum wins the argument — but by a margin that should not be oversold. The middle half of 3-day outcomes ran from -4.2% to +8.8%, and the worst single case was -30.4%. The path was rough even for events that ended well: the median worst dip inside the three days was -5.65%, the median best rise was +8.45%, and 56.2% of all events dipped more than 5% below the signal close at some point before the horizon ended. A small statistical tilt sits inside a very wide distribution.
By year (move after 3 days)
| Year | Events | Closed higher | Median move |
|---|---|---|---|
| 2021 | 30 | 66.7% | +6.68% |
| 2022 | 18 | 44.4% | -1.17% |
| 2023 | 24 | 66.7% | +2.91% |
| 2024 | 15 | 46.7% | -0.90% |
| 2025 | 14 | 28.6% | -3.84% |
| 2026 | 4 | 50.0% | +2.32% |
Calculated on historical prices; not actual trades. Fees and slippage not included.
The year table shows how unevenly that tilt is distributed. In 2021, 66.7% of 30 events closed higher with a median of +6.68%, and 2023 looked similar. In 2025, only 28.6% of 14 events closed higher, with a median of -3.84%. Nothing about the rule changed; the market regime did.
Split: close above vs below the 200-day EMA (move after 3 days)
| Group | Events | Closed higher | Median move | Worst |
|---|---|---|---|---|
| Close above EMA 200 | 67 | 61.2% | +2.89% | -30.4% |
| Close below EMA 200 | 38 | 42.1% | -1.17% | -25.5% |
Calculated on historical prices; not actual trades. Fees and slippage not included.
This is the most useful cut in the study. With the close above the 200-day EMA, 67 events produced 61.2% higher closes and a median of +2.89%. With the close below it, 38 events produced 42.1% higher closes and a median of -1.17%. In other words, the continuation effect lived almost entirely inside uptrends. A big up day inside a downtrend behaved more like a bounce that faded — though the worst outcome in the above-EMA group, -30.4%, shows the filter removes neither tail.
Where it failed
The three worst 3-day outcomes are instructive. On 2021-05-18 00:00 UTC, price closed at 55.95 after an 8%-plus day and was -30.4% three days later, having been as much as -54.9% below the signal close along the way — the broad crypto liquidation of mid-May 2021. On 2021-09-18 00:00 UTC, from 169.2, the three-day move was -26.6% with a dip of -31.7%. On 2022-11-10 00:00 UTC, from 17.61, the result was -25.5% with a dip of -27.3%; that date sits inside the November 2022 FTX collapse, an event that hit this market particularly hard.
The pattern in all three is the same: the big up day was a violent rebound inside a market under stress, not an acceleration of an existing trend. By contrast, the two best cases — 2021-08-13 00:00 UTC at 44.90 for +38.4%, and 2023-12-20 00:00 UTC at 82.24 for +31.3% — had shallow dips of -4.7% and -1.5%, meaning price barely looked back. Recent events were tamer in both directions: -0.8% on 2026-02-06, -4.2% on 2026-02-25, +9.9% on 2026-08-19 and +5.5% on 2026-09-18.
How to read it on your chart
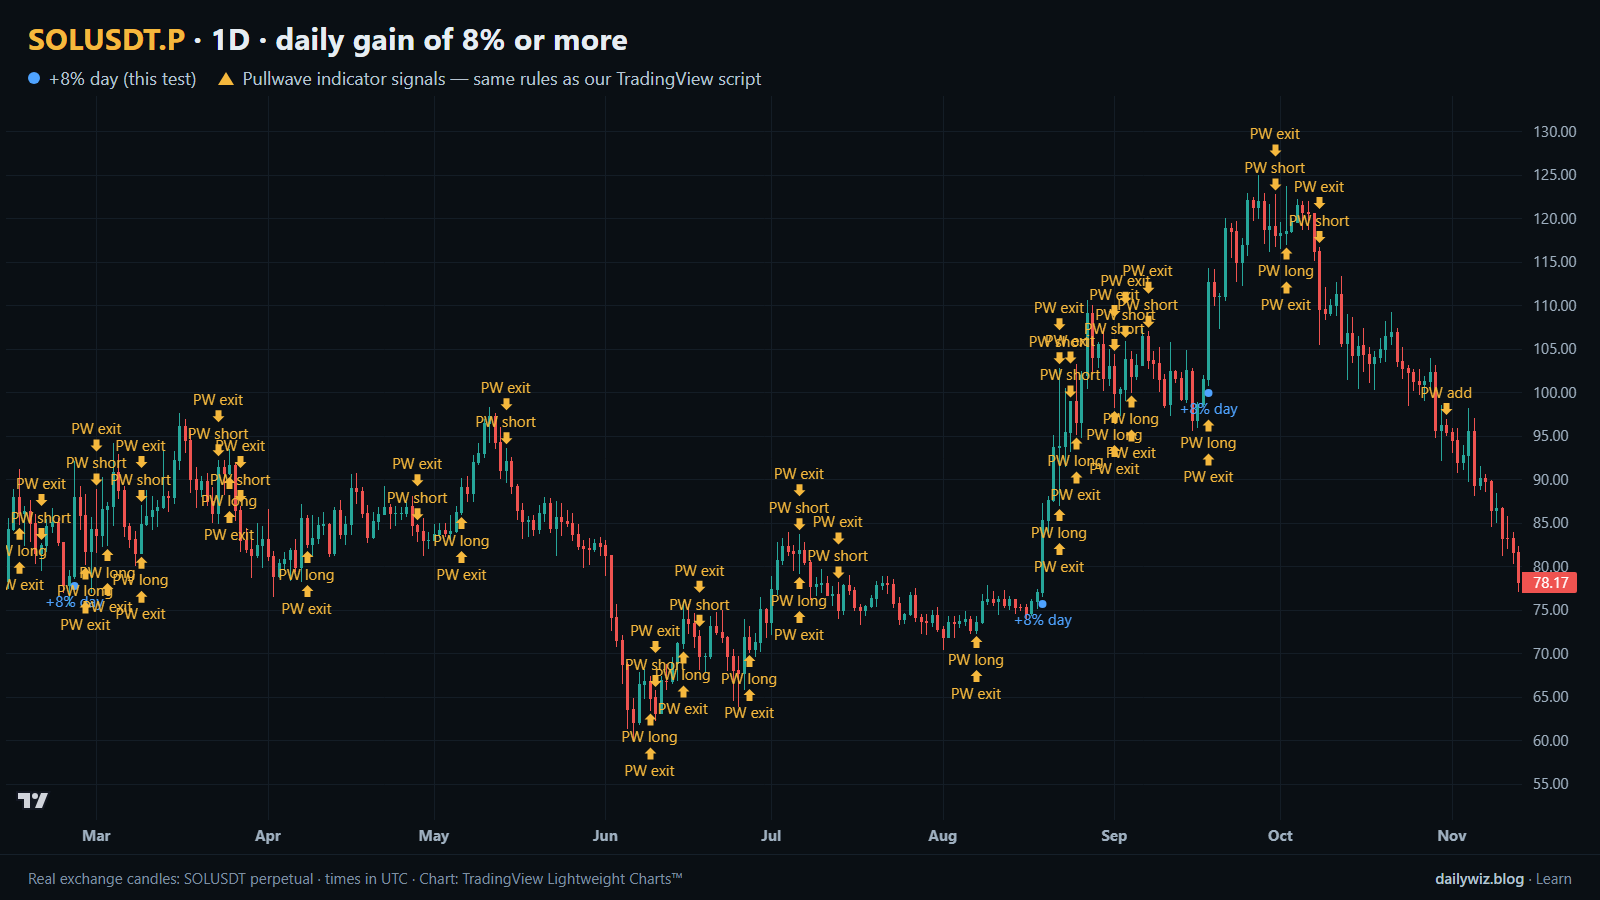
On the chart above, the blue dots mark each day that met the rule. Before treating one as information, check where it sits relative to the 200-day EMA, since that single question separated 61.2% from 42.1% in our sample. Check also what preceded it: a big day that merely recovers part of a recent collapse is a different animal from one that extends a trend already in place.
What would invalidate the reading? A failure to hold the signal close in the following sessions, or a market where the whole asset class is moving together on forced selling. And whatever conclusion you draw, size it for the path, not the median: more than half of all events spent time underwater before the horizon closed. If you use this, consider it a context filter that adjusts how you treat other setups, rather than a trigger on its own.
How the Pullwave indicator approaches this
Pullwave is an invite-only TradingView indicator, published at pullwave.net. It is rule-based: fixed rules on price and volume, with no discretion. Its rules are not published, it does not predict the future, and it has losing trades. The futures version is built around SOLUSDT perpetual futures. The user places any orders themselves; the indicator only draws marks and can send a TradingView alert when a mark prints.
It appears here for structural comparison, not as a competitor to today's rule. On the chart above, the blue dots come from one condition and one condition only. The gold arrows are Pullwave's marks on the same candles, taken from the public record on its site, and they cover more than entries: long and short entries, add-ons, partial exits and exits. Compare where the two sets land, and where they do not. The general idea worth taking away is that a single-condition trigger is noisy on its own, while a complete rule set also has to answer when to add, when to take partial profit and when to leave.
Key takeaways
- Across 105 events, SOLUSDT leaned toward continuation after an 8% day: 54.3% closed higher after 3 days versus a 50.0% baseline, median +2.07% versus -0.00%.
- The edge is small relative to the spread: the middle half of outcomes ran -4.2% to +8.8%, and the worst case was -30.4%.
- Trend context did most of the work. Above the 200-day EMA, 61.2% closed higher; below it, 42.1%, with a median of -1.17%.
- The path was uncomfortable even in winning cases: 56.2% of events dipped more than 5% below the signal close within three days.
- Results varied by year, from 66.7% higher in 2021 to 28.6% in 2025, so if you use this, consider treating it as regime-dependent context rather than a standalone signal.
The gold arrows on the chart are marks from the Pullwave indicator for TradingView. See how the Pullwave indicator works on pullwave.net.
Chart rendered with TradingView Lightweight Charts™ from real exchange candles. tradingview.com