BCH 1H volume spikes: 780 events, 49.4% closed higher after a day
We tested 780 hourly volume spikes above 3x the 20-bar average on BCH/USDT. After one day, 49.4% closed higher against a 48.6% baseline, and the median move was +0.00% — close to no edge.
- Market
- BCH/USDT spot
- Timeframe
- 1H
- Data
- Nov 2022 – Oct 2026
- Sample
- 780 events
A volume spike is one of the few chart features almost every trader notices without being taught. A tall histogram bar prints under the candle, far above its neighbors, and the instinct says something has changed. The disagreement is about what: the same spike gets called breakout confirmation by one trader and exhaustion by another, usually after the fact.
So we took a version of the idea with no judgment calls in it and counted what happened next. The question: on BCH/USDT hourly candles, when a closed bar's volume is more than three times the average of the previous 20 bars, does the move continue or fade — and is the answer any different from what follows an ordinary bar?
What Volume spikes measures
Volume is how many units changed hands during the bar. The raw number says little on its own, because volume in a quiet weekend hour is not comparable to volume in a weekday news hour, so it is almost always read as a relative measure.
The calculation in words: take the volume of the bar that just closed, take the average volume of a fixed number of bars before it — 20 is the common choice — and compare the two. If the closed bar sits far above that average, you have a spike. Thresholds of 2 or 3 times the average are the usual settings.
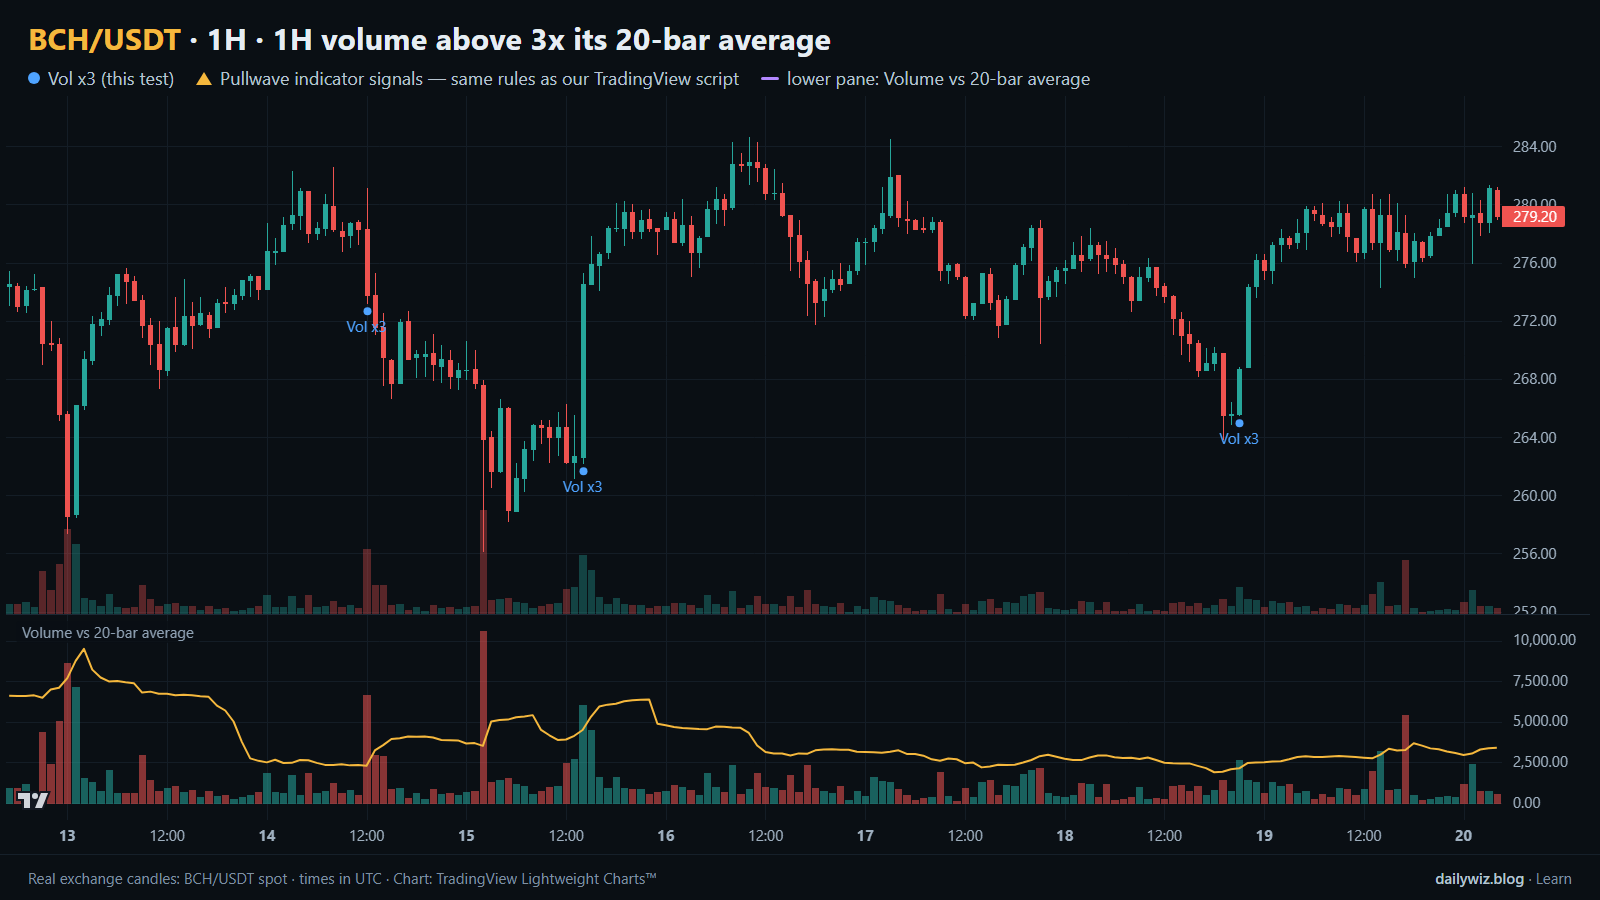
Two standard readings exist and they contradict each other. The continuation reading says the spike shows real participation, so the move should extend. The exhaustion reading says it shows the last of the urgency, so the move should stall. The spike itself does not tell you which story applies, which is why it is worth measuring rather than assuming. In the lower pane of the chart above, volume is plotted against its 20-bar average, and the blue dots mark the bars where the threshold was crossed.
The test
We used Binance BCH/USDT spot candles on the 1H timeframe, from Nov 2022 to Oct 2026 — 34781 bars. All timestamps are UTC.
The rule: the volume of a closed 1H bar is more than 3 times the average volume of the previous 20 bars. After an event, new events are ignored for the next 24 bars. That cooldown matters because spikes cluster; without it, one volatile afternoon would contribute a dozen near-identical observations. With it, the rule produced 780 events.
Outcomes were measured from the close of the signal bar to the close a fixed number of bars later: 4 hours, 1 day and 3 days. Inside the 1-day window we also recorded the deepest dip and the highest rise relative to the signal close, so the path is visible and not only the endpoint. The baseline is the same measurement taken from every bar in the period, signal or not. That is the number a spike has to beat to mean anything.
These figures were calculated on historical prices; they are not actual trades. No fees or slippage are included, and on an hourly rule that fires hundreds of times those costs would matter.
Results
What happened after the signal (1H volume above 3x its 20-bar average)
| After | Events | Closed higher | Median move | Middle half (25th / 75th pct) | Worst | Baseline: closed higher | Baseline: median |
|---|---|---|---|---|---|---|---|
| 4 hours | 780 | 50.6% | +0.04% | -0.8% / +0.7% | -5.7% | 48.5% | +0.00% |
| 1 day | 780 | 49.4% | +0.00% | -2.0% / +2.0% | -23.6% | 48.6% | -0.07% |
| 3 days | 779 | 48.0% | -0.18% | -3.2% / +3.4% | -23.1% | 48.2% | -0.20% |
Calculated on historical prices; not actual trades. Fees and slippage not included.
The edge is small and does not survive being held. After 4 hours, 50.6% of events closed higher against a baseline of 48.5%, with a median move of +0.04% against a baseline median of +0.00%. That is the best cell in the table. By 1 day, 49.4% closed higher against 48.6%, with a median of +0.00%. By 3 days the signal sits behind the baseline on both measures: 48.0% against 48.2%, and a median of -0.18% against -0.20%.
The means look friendlier — +0.09%, +0.27% and +0.56% — and the extremes explain why. The best 1-day outcome was +46.9% and the best 3-day outcome was +66.5%, while the worst 1-day outcome was -23.6%. A few very large winners lift the average while the typical event does essentially nothing, so the median is the better description here.
The path deserves as much attention as the endpoint. The median worst dip inside the 1-day window was -2.10%, the median best rise was +2.32%, and 16.0% of events dipped more than 5% before the day was out.
By year (move after 1 day)
| Year | Events | Closed higher | Median move |
|---|---|---|---|
| 2022 | 27 | 37.0% | -0.68% |
| 2023 | 193 | 54.4% | +0.28% |
| 2024 | 200 | 47.0% | -0.25% |
| 2025 | 200 | 56.0% | +0.54% |
| 2026 | 160 | 40.0% | -0.41% |
Calculated on historical prices; not actual trades. Fees and slippage not included.
By year the sign flips repeatedly: 54.4% higher with a median of +0.28% in 2023, 47.0% and -0.25% in 2024, 56.0% and +0.54% in 2025, 40.0% and -0.41% in 2026. The 2022 row holds only 27 events and should not be read as a trend. A rule whose sign changes from year to year looks more like regime-dependent noise than a stable property of volume.
Split: close above vs below the 200-bar EMA (move after 1 day)
| Group | Events | Closed higher | Median move | Worst |
|---|---|---|---|---|
| Close above EMA 200 | 372 | 46.8% | -0.18% | -16.5% |
| Close below EMA 200 | 408 | 51.7% | +0.16% | -23.6% |
Calculated on historical prices; not actual trades. Fees and slippage not included.
The EMA 200 split is mildly surprising. Events whose signal bar closed below the EMA 200 did a little better — 408 events, 51.7% higher, median +0.16% — than those above it, at 372 events, 46.8% higher and a median of -0.18%. With gaps this small, that reads as a caution against assuming a trend filter helps rather than as evidence the inverse works.
Where it failed
The worst single event was 2025-02-02 03:00 UTC, with price at 392.3. One day later the move was -23.6%, and the deepest dip inside that day reached -31.2%. The spike printed into a fast, broad decline; the burst of volume was the market repricing downward, not a base forming.
The second worst, 2025-03-03 13:00 UTC at 356.1, gave -16.5% with a worst dip of -17.0% — almost a straight line down, with no bounce to exit into. Third, 2026-06-02 19:00 UTC at 281.4, gave -13.4% with a worst dip of -14.1%, the same shape again.
Each of these was indistinguishable from a good one at the moment it printed. Compare the best cases: 2024-03-02 00:00 UTC at 338.2 ran +46.9% with a worst dip of only -0.6%, and 2026-08-21 01:00 UTC at 226.2 ran +30.4% with a worst dip of -0.5%. The winners barely traded against the signal close and the losers barely traded in its favor. What separated them was not in the volume reading.
The events near the chart window are more typical of the sample: 2026-10-12 06:00 UTC at 286.2 gave -3.8% with a dip of -10.1%, and 2026-10-18 21:00 UTC at 268.7 gave +3.6% with a dip of 0.0%.
How to read it on your chart
If you use volume spikes, the test suggests treating them as an attention trigger rather than a decision. Three checks are worth making. First, what the spike is attached to: a spike on a bar that closes back inside the prior range tells a different story from one that closes beyond it, and our rule ignored that distinction. Second, whether the 20-bar average is itself depressed, since a quiet overnight stretch makes the threshold easy to cross on unremarkable activity. Third, the higher-timeframe context, because the EMA 200 split shows the same signal behaving differently depending on where it lands.
The immediate aftermath is what invalidates it. With a median worst dip of -2.10% inside the day, a spike that gives the whole bar back within a few hours has already answered the question. On the chart above, read the blue dots together with the lower pane and notice how little the dot itself says about the hours that followed. Any use of this trigger needs a risk limit decided before the signal, because the loss tail is longer than the median suggests.
How the Pullwave indicator approaches this
Pullwave is an invite-only TradingView indicator. It is rule-based: fixed rules on price and volume, with no discretion. Its rules are not published, it does not predict the future, and it has losing trades.
The comparison here is structural, not numerical. The rule we tested is a single condition that fires once and then falls silent; it never says whether the move has proven itself, when to reduce, or when the premise is gone. Pullwave marks long and short entries, add-ons, partial exits and exits on the chart, and it can send a TradingView alert when a mark prints. The user places any orders themselves; the indicator only draws marks and sends alerts.
The gold arrows on the chart above are Pullwave's marks on the same candles, taken from the public record under the same rules as the TradingView script. Comparing where those arrows print, and where they do not, against the blue dots of the tested technique is the useful exercise. The idea a reader can keep is that a single-condition trigger is noisy on its own, while a complete rule set also has to answer when to add, when to take partial profit and when to exit.
Key takeaways
- Across 780 events on BCH/USDT 1H, a volume spike above 3 times the 20-bar average was followed by a higher close 49.4% of the time after 1 day, against a baseline of 48.6% for any bar.
- The only horizon that looked mildly better than baseline was 4 hours, at 50.6% versus 48.5%; by 3 days the signal sat behind the baseline on both measures.
- Means were lifted by rare outliers such as +46.9% and +66.5%, while the medians of +0.00% and -0.18% describe the typical event.
- The path is bumpier than the result: median worst dip -2.10%, median best rise +2.32%, and 16.0% of events dipped more than 5% within the day.
- If you use volume spikes, consider them a reason to look rather than a reason to act, paired with context and a predefined risk limit.
The gold arrows on the chart are marks from the Pullwave indicator for TradingView. See how the Pullwave indicator works on pullwave.net.
Chart rendered with TradingView Lightweight Charts™ from real exchange candles. tradingview.com