SOLUSDT: Does Top-5% Perp Funding Really Mean Price Falls Next?
We counted 148 extreme positive funding prints on the SOLUSDT perpetual. One day later price closed higher 53.4% of the time, with a +0.84% median — the opposite of the usual flush story.
- Market
- SOLUSDT perpetual futures
- Timeframe
- 1H
- Data
- Sep 2020 – Oct 2026
- Sample
- 148 events
High positive funding is one of the most quoted warning signs in crypto. The story is simple and intuitive: a perpetual contract trading above spot means leveraged buyers are crowded on one side, those buyers are paying shorts to hold the position, and sooner or later the crowd gets flushed. Every time a chart goes vertical, somebody posts a funding screenshot with the word "overheated" attached.
We wanted to know whether counting supports the story. The question today is narrow and testable: on the SOLUSDT perpetual, when an 8-hour funding print lands in the top 5% of its own history, does price tend to fall afterwards — and does it behave any differently from a bar picked at random?
What Funding rates on perpetual futures measures
A perpetual future has no expiry date, so there is no settlement to pull its price back toward spot. Exchanges solve this with a funding payment. At fixed intervals, usually every 8 hours, the exchange looks at how far the perpetual has traded above or below an index of spot prices, adds a small interest component, and turns that into a rate. If the rate is positive, holders of long positions pay holders of short positions. If it is negative, shorts pay longs. Nobody pays the exchange; the money moves between traders.
The number itself is small, typically a fraction of a percent per interval. Its value as information is not the cash flow but the message: sustained positive funding says that traders are willing to pay a fee to stay long, which is a direct reading of leveraged positioning rather than an indicator derived from price.
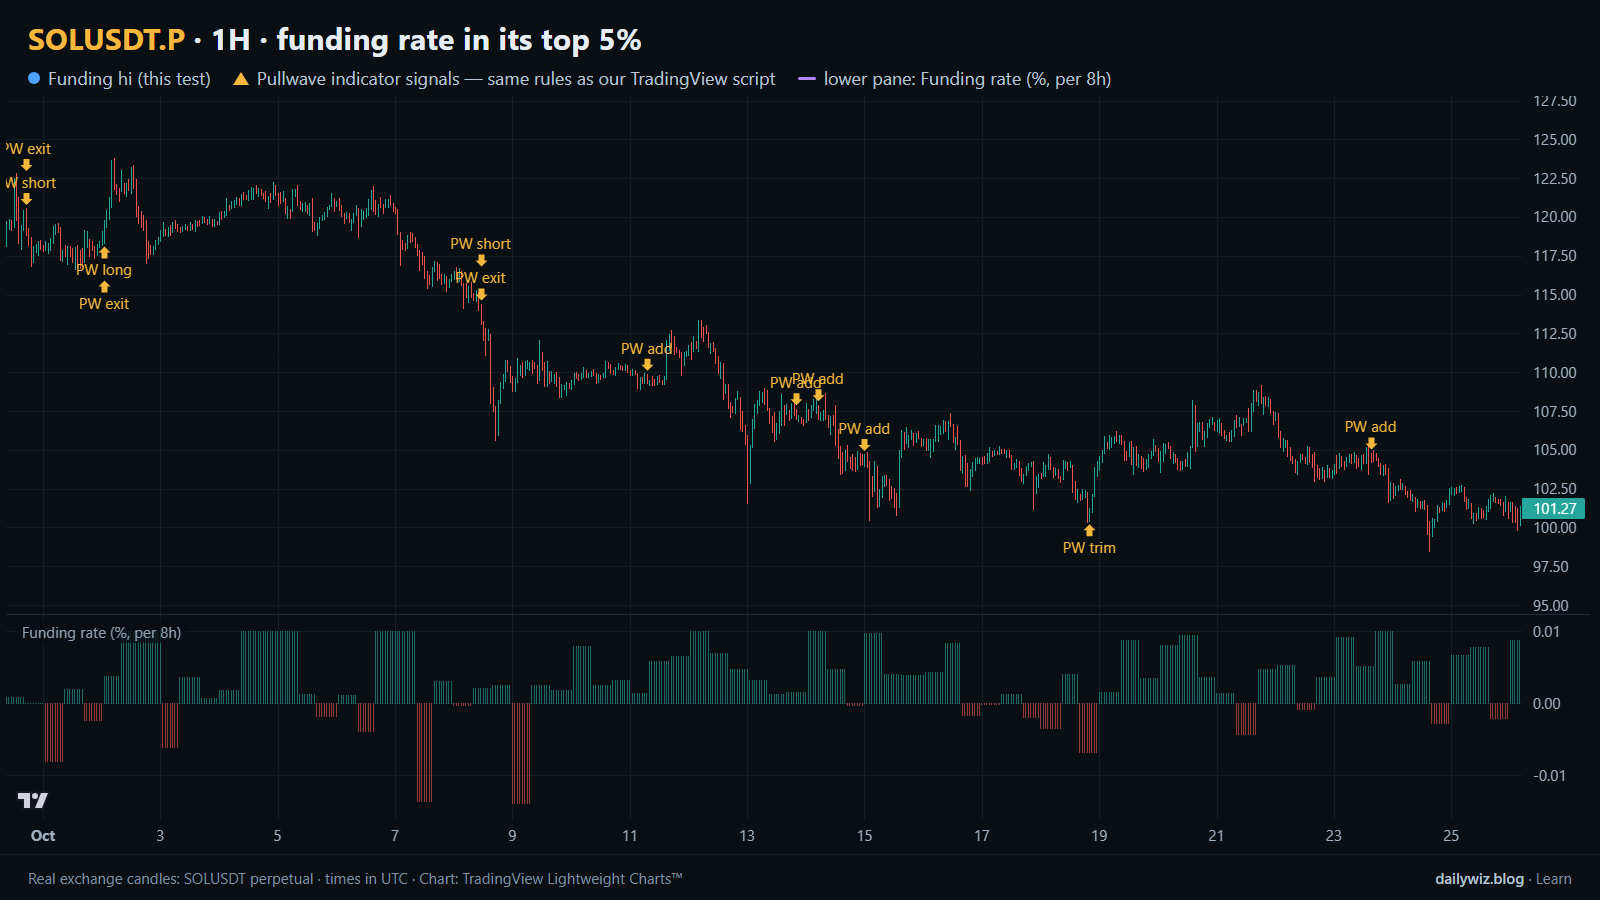
Because what counts as "high" differs from one asset and one regime to another, most traders read funding against its own history instead of against a fixed number. That is the approach we used. Taking every 8-hour print on this contract, the 95th percentile sits at 0.0444% per 8h. Any print at or above that line is what we call an extreme positive funding event. In the chart above, the lower pane shows the funding rate in percent per 8h, and the blue dots mark the bars where an event printed.
The test
The data is Binance USDⓈ-M perpetual SOLUSDT candles on the 1H timeframe, from Sep 2020 to Oct 2026, which is 53590 bars. All timestamps are UTC.
The rule: each 8-hour funding print on the SOLUSDT perpetual that is at or above the 95th percentile of all prints since June 2021 counts as an event, with entry at the close of the 1H bar in which the print appears. After an event, new events are ignored for 24 bars, so a long stretch of elevated funding cannot flood the sample with near-identical observations. That left 148 events.
Outcomes were measured from the close of the signal bar to the close N bars later, at three horizons: 8 hours, 1 day, and 3 days. The main horizon is 1 day. For each horizon we also measured the same thing starting from every bar in the sample, which is the baseline — what you would have seen without any signal at all. If the event column and the baseline column look alike, the signal told you nothing.
These figures were calculated on historical prices; they are not actual trades. No fees, funding costs or slippage are included, and real execution would shift every number in the table.
Results
What happened after the signal (funding rate in its top 5%)
| After | Events | Closed higher | Median move | Middle half (25th / 75th pct) | Worst | Baseline: closed higher | Baseline: median |
|---|---|---|---|---|---|---|---|
| 8 hours | 148 | 51.4% | +0.04% | -2.8% / +2.3% | -10.3% | 49.8% | -0.00% |
| 1 day | 148 | 53.4% | +0.84% | -3.7% / +6.2% | -27.5% | 49.6% | -0.03% |
| 3 days | 148 | 64.2% | +3.50% | -2.5% / +13.4% | -26.2% | 50.0% | +0.01% |
Calculated on historical prices; not actual trades. Fees and slippage not included.
The direction is the opposite of the popular story. One day after an extreme positive funding print, price closed higher 53.4% of the time against a baseline of 49.6%, with a median move of +0.84% versus a baseline median of -0.03%. At 8 hours the difference is thin: 51.4% higher against 49.8%, and a median of +0.04%. At 3 days the gap is widest, 64.2% higher against a baseline of 50.0%, with a median of +3.50%.
Read that carefully before taking it anywhere. Extreme funding on this contract historically clustered inside strong uptrends, and strong uptrends tend to keep going for a few days more often than they reverse. The signal is not identifying exhaustion; it is identifying momentum that has already been paid for.
The path to those closes was rough. Within the day after an event, the median worst dip was -4.99%, and 49.3% of events dipped more than 5% at some point before the day ended. The median best rise inside the same window was +4.16%. The middle half of 1-day outcomes ran from -3.7% to +6.2%. So roughly half of these events put you underwater by more than five percent at some point, even though the typical close was positive. A tight stop would have been hit constantly.
By year (move after 1 day)
| Year | Events | Closed higher | Median move |
|---|---|---|---|
| 2020 | 6 | 16.7% | -5.09% |
| 2021 | 103 | 54.4% | +0.96% |
| 2023 | 12 | 33.3% | -2.77% |
| 2024 | 27 | 66.7% | +1.03% |
Calculated on historical prices; not actual trades. Fees and slippage not included.
This is the table that should slow you down. Of the 148 events, 103 landed in 2021 — one market regime dominating the entire sample. In 2020 only 16.7% of events closed higher after a day, with a median of -5.09%, and 2023 was also negative at 33.3% higher and a median of -2.77%. The friendly aggregate is mostly a 2021 and 2024 result. Years with no rows produced no qualifying prints at all, which is worth remembering: this is a rare signal that arrives in bursts.
Where it failed
The worst single outcome came on 2020-11-25 17:00 UTC, where price closed -27.5% lower a day later after dipping -29.2%. That event sits in the small, overwhelmingly negative 2020 group.
The second worst, on 2021-05-18 17:00 UTC, is the one most readers will recognize: the mid-May 2021 market-wide crash. Price closed -18.9% lower one day on, but the intraday path was far uglier, with a worst dip of -53.3%. An event that ends down less than nineteen percent can still have gone through a drawdown that no leveraged position survives. Then on 2021-08-24 09:00 UTC, price closed -14.2% lower with a dip of -16.4%.
The best cases show the same width in the other direction: +33.3% after the event on 2021-01-08 08:00 UTC, with no adverse move at all recorded along the way, and +31.4% after 2021-04-18 01:00 UTC, which first dipped -20.0%. The more recent cluster was far tamer. The four events in late 2024 — 2024-11-12 16:00, 2024-11-17 08:00, 2024-12-05 08:00 and 2024-12-08 00:00 UTC — produced moves of +2.7%, +2.0%, +0.9% and -2.3%, with dips of -5.2%, -3.6%, -5.0% and -2.6%.
How to read it on your chart
If you track funding, the first thing to check is which market you are in. The test suggests that on this contract an extreme print has been a continuation marker inside trends, not a top signal — but the 2020 and 2023 rows show that the same print in a weak or range-bound tape behaved very differently. Context, not the print, carried the result.
The second thing to check is your risk distance. With roughly half of events dipping more than 5% within the day, any plan built around a stop tighter than the typical adverse excursion would have been stopped out of the outcomes the table describes.
What invalidates the reading: a cluster of events in a market that has already lost its trend structure, and extreme funding appearing alongside a broad market-wide liquidation, as in May 2021. In the chart above, notice that the window shown contains no blue dots at all. That is normal. A signal that fires this rarely cannot be the backbone of a routine; at best it is a condition you layer onto an existing trend and risk framework.
How the Pullwave indicator approaches this
Pullwave is an invite-only TradingView indicator, published at pullwave.net. It is rule-based: fixed rules on price and volume, with no discretion involved. Its futures version is built around the SOLUSDT perpetual, and a separate spot version runs on major coins. The rules themselves are not published, it does not predict the future, and it has losing trades.
On the chart above, the gold arrows are Pullwave's marks on the same candles, taken from the public record on pullwave.net, which uses the same rules as the TradingView script. Compare them with the blue dots of the technique we tested here. The dots mark a condition and nothing else; the arrows mark long and short entries, add-ons, partial exits and exits, and an alert can fire when a mark prints. The user places any orders themselves — the indicator only draws and alerts.
The general idea a reader can take from the comparison is the useful part: a trigger that rests on a lone condition is noisy by itself, while a complete rule set also has to answer when to add, when to take partial profit and when to leave.
Key takeaways
- Across 148 events on the SOLUSDT perpetual, extreme positive funding was followed by a higher close 53.4% of the time after a day, against a 49.6% baseline — continuation, not the expected flush.
- The 3-day reading was the strongest at 64.2% higher with a +3.50% median, but 103 of the events came from a single year, so treat the aggregate as regime-dependent.
- The path was violent: 49.3% of events dipped more than 5% within the day, and the May 2021 case drew down -53.3% intraday.
- If you use funding as a signal, consider reading it as a positioning gauge inside an existing trend framework rather than as a standalone reversal trigger.
- Figures exclude fees and slippage and come from historical prices, so treat them as a description of the past, not an expectation.
The gold arrows on the chart are marks from the Pullwave indicator for TradingView. See how the Pullwave indicator works on pullwave.net.
Chart rendered with TradingView Lightweight Charts™ from real exchange candles. tradingview.com