BTC/USDT 4H: Do Swings Really Turn at 0.382, 0.5 and 0.618?
We measured 76 BTC/USDT swings on the 4H chart from Nov 2022 to Oct 2026. Retracements ended near 0.618 in 0.0% of cases, while the meaningless 0.700 control level caught 6.6% of them.
- Market
- BTC/USDT spot
- Timeframe
- 4H
- Data
- Nov 2022 – Oct 2026
- Sample
- 76 samples
When a trader drags a Fibonacci tool across a chart, the claim being made is unusually easy to check: a pullback is supposed to be more likely to stop near 0.382, 0.5 or 0.618 of the previous move than near some other fraction of it. That is not a vague statement about sentiment. It is a statement about where turning points cluster, and clusters can be counted.
So we counted them. Today's question is narrow on purpose: on the 4-hour BTC/USDT chart, do swings end near the classic ratios more often than near three nearby levels we invented for comparison? If they do, the lines deserve their reputation. If they do not, they remain a shared reference that many traders watch, but not a forecast of where price turns.
What Fibonacci retracements measures
A Fibonacci retracement is a measuring tool, not a signal generator. You pick a completed move — a swing low to a swing high, or the reverse — treat the distance between those two anchors as the whole move, equal to 1, and mark fractions of that distance back toward the start. The usual set is 0.236, 0.382, 0.5, 0.618 and 0.786.
In words, the arithmetic is: take the size of the move, multiply it by the fraction, then subtract that amount from the high for an upward move, or add it to the low for a downward move. The 0.5 line is simply the midpoint and has nothing to do with the Fibonacci sequence; it is included by convention. The 0.382 and 0.618 lines come from ratios of consecutive Fibonacci numbers, and 0.786 is derived from 0.618.
The conventional reading is that a healthy trend pulls back into the shallow or middle part of the grid and then resumes, while a retracement that pushes past 0.786 and then past 1.0 is a reversal rather than a pullback. All of that rests on one assumption: that turns happen near those particular fractions more often than elsewhere.
The test
We used Binance BTC/USDT spot candles on the 4H timeframe from Nov 2022 to Oct 2026, which is 8701 bars. All timestamps are UTC.
Swings were defined mechanically by an 8% zigzag computed on 4H closes, so that anchors and turning points are closes rather than wicks. That produced 76 completed swings. For each completed swing we measured how deep the next swing retraced it, where 0 means no retracement and 1 means a return to the exact origin of the prior swing. A value above 1 means the next swing went through that origin and became a full reversal. Depth was read from closes — the close of the signal bar and the closes that followed it — so a wick poking through a line does not count as a turn there.
We then counted how many retracements ended within ±0.03 of 0.382, 0.5 and 0.618, and ran the identical count for three control levels — 0.44, 0.56 and 0.70 — which sit in the same neighborhood and carry no theoretical meaning. Those controls are the baseline: since we are measuring where swings end rather than timing entries, the fair comparison for a supposedly special level is an ordinary one. The cooldown is built into the method, because a zigzag produces non-overlapping swings, so each swing contributes exactly one measurement and no turn is counted twice. These figures were calculated on historical prices; they are not actual trades. No fees or slippage are included.
Results
How deep did each retracement go? (share of swings)
| Retracement depth | Swings | Share |
|---|---|---|
| 0.000 – 0.236 | 1 | 1.3% |
| 0.236 – 0.382 | 9 | 11.8% |
| 0.382 – 0.500 | 1 | 1.3% |
| 0.500 – 0.618 | 4 | 5.3% |
| 0.618 – 0.786 | 11 | 14.5% |
| 0.786 – 1.000 | 9 | 11.8% |
| Beyond 1.000 (full reversal) | 41 | 53.9% |
Calculated on historical prices; not actual trades. Fees and slippage not included.
The distribution is the first surprise. The most common single outcome, 41 of the swings, is "beyond 1.000": 53.9% of retracements did not stop inside the grid at all. They erased the entire prior swing and kept going. The median depth was 1.117, which means the typical move after a completed swing on this timeframe was not a pullback but the beginning of a move in the other direction.
At the shallow end, 13.2% of retracements never reached 0.382. That leaves the middle of the grid, where the tool is supposed to earn its keep, holding a thin share of the sample. The 0.382 to 0.500 band contains 1 swing, or 1.3% — the region traders watch most closely is the one BTC visited least.
Swings that turned within ±0.03 of a level
| Level | Type | Share of swings |
|---|---|---|
| 0.382 | Fibonacci | 1.3% |
| 0.500 | Half-way | 2.6% |
| 0.618 | Fibonacci | 0.0% |
| 0.440 | Control | 1.3% |
| 0.560 | Control | 2.6% |
| 0.700 | Control | 6.6% |
Calculated on historical prices; not actual trades. Fees and slippage not included.
This is the direct answer to the question. Within ±0.03, the 0.382 level caught 1.3% of swings, 0.500 caught 2.6%, and 0.618 caught 0.0%: not one swing in the sample ended inside the tolerance band around the golden ratio. The controls were not worse. The 0.440 control matched 0.382 at 1.3%, the 0.560 control matched 0.500 at 2.6%, and 0.700, a line nobody draws, was the most frequent of all six at 6.6%.
With 76 swings, no single share here is large enough to support a strong claim about any one level, and that is the point. The honest reading is that this sample shows no measurable edge for the Fibonacci ratios over the controls, and the level that stood out was one we made up.
Where it failed
There are no individual losing trades to show, because the test places none. The failure is structural, and it appears in three places.
First, the 0.618 column is empty: across the whole period, the level most often described as a high-probability reversal zone accounted for 0.0% of measured retracements. Second, the controls held their own, and 0.700 attracted more turns than any Fibonacci line tested. A tool that captures something real about market structure should beat lines picked arbitrarily from the same range.
Third, and most consequential, the grid was usually irrelevant. With 53.9% of retracements going beyond 1.000 and a median depth of 1.117, the common case for an 8% zigzag swing on BTC/USDT was full reversal. A plan that assumes a pullback will pause somewhere inside the grid was planning for the minority outcome in this sample.
How to read it on your chart
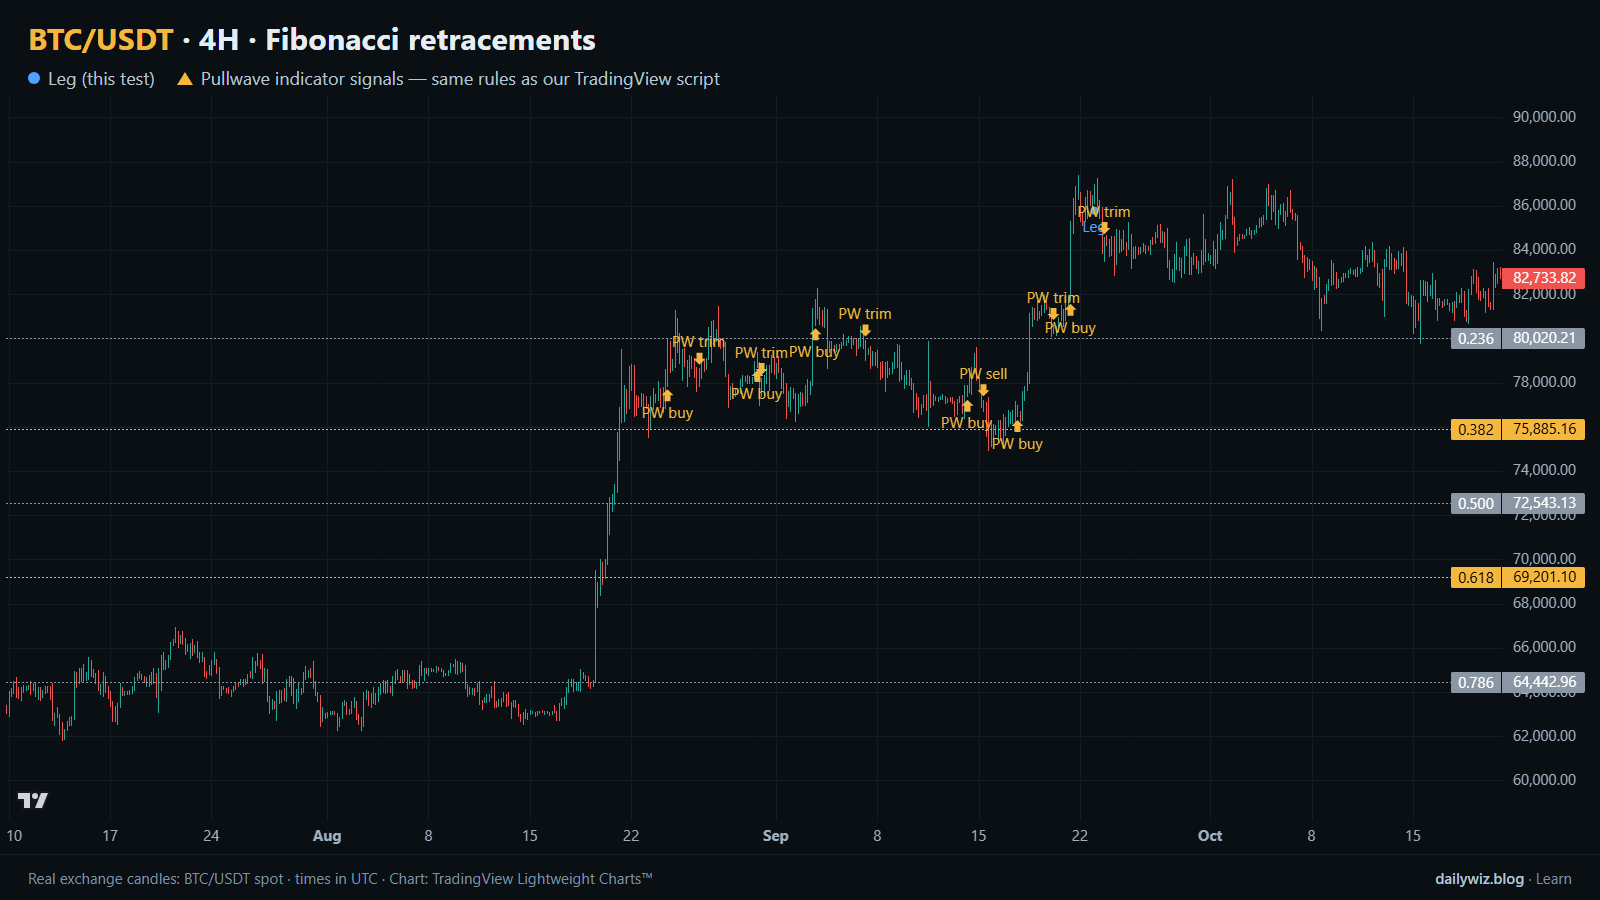
On the chart above, the blue dots mark the current leg, which is not yet confirmed as a completed swing: it runs from 58,382 on 2026-06-30 to 86,704 on 2026-09-23. The horizontal price lines are the 0.236, 0.382, 0.500, 0.618 and 0.786 retracement levels drawn from that leg.
The unconfirmed status matters. A zigzag only names a swing once the move in the other direction is large enough, so a grid drawn in real time can later be redrawn from different anchors. Much of the apparent precision of Fibonacci levels comes from choosing the anchors after the fact.
If you use retracements, the test suggests treating them as a map rather than a forecast. Before trusting a level, consider checking three things: whether your anchors would still be the anchors if the next bars extended the move; whether you are measuring closes or wicks, since the two produce different lines; and whether the larger trend is intact, because this sample says continuation past the origin was the dominant outcome. What invalidates the reference is visible and simple — price trading beyond 1.000, after which the swing you measured is no longer the relevant one.
A defensible use is risk definition. If you are positioned for reasons of your own, the next line down gives a defined place to be wrong, and the 0.786 and 1.000 marks separate a pullback from a reversal. What these numbers do not support is treating a touch of 0.618 as a reason to act on its own.
How the Pullwave indicator approaches this
The gold arrows on the chart above are Pullwave's marks on the same candles, taken from the public record on pullwave.net, and they come from the same rules as the TradingView script. Comparing them with the blue dots of the tested technique is the useful exercise here.
Pullwave is an invite-only TradingView indicator. It is rule-based: fixed rules on price and volume, no discretion. On the chart it marks long and short entries, add-ons, partial exits and exits, and it can send a TradingView alert when a mark prints. The futures version is built around SOLUSDT perpetual futures; the spot version runs on major coins. Its rules are not published, it does not predict the future, and it has losing trades. The user places any orders themselves; the indicator only draws marks and sends alerts.
The general idea a reader can take away from today's result is this: a single-condition trigger, like a touch of one retracement line, is noisy on its own. A complete rule set also has to answer when to add, when to take partial profit and when to exit.
Key takeaways
- In 76 BTC/USDT 4H swings from Nov 2022 to Oct 2026, retracements ended within ±0.03 of 0.382 in 1.3% of cases, of 0.500 in 2.6%, and of 0.618 in 0.0%.
- The control levels, which carry no theoretical meaning, were not worse: 0.440 at 1.3%, 0.560 at 2.6% and 0.700 at 6.6%, the highest of the six levels tested.
- The dominant outcome was not a retracement at all. In this sample 53.9% of swings went beyond 1.000, with a median depth of 1.117.
- If you use retracements, consider them a way to define risk and to mark where a pullback stops being a pullback, rather than a reason to act at one specific line.
- Anchors decide everything. The leg on the chart above is not yet a confirmed swing, so the grid drawn from it can still change.
The gold arrows on the chart are marks from the Pullwave indicator for TradingView. See how the Pullwave indicator works on pullwave.net.
Chart rendered with TradingView Lightweight Charts™ from real exchange candles. tradingview.com