SOL closes below the lower Bollinger Band: does it snap back?
We counted 928 one-hour closes below the lower Bollinger Band on SOLUSDT perpetual futures. A day later, 50.0% closed higher against a 49.6% baseline — the stretch alone added almost nothing.
- Market
- SOLUSDT perpetual futures
- Timeframe
- 1H
- Data
- Sep 2020 – Oct 2026
- Sample
- 928 events
Few chart events feel as obvious as a candle that closes outside its lower Bollinger Band. The bands are supposed to contain most of the recent action, so when price pushes through the lower one the market looks stretched, and the natural thought is that something has to snap back. On a fast market like SOL, where a handful of 1H candles can cover a lot of ground, that thought turns into a trade idea very quickly.
The question we set out to answer is narrow and testable: after SOL closes below its lower Bollinger Band on the 1H chart, is the next day any better than an ordinary day? We counted every instance on Binance perpetual futures candles and compared the outcome with what a randomly chosen bar produced over the same period. The answer is less exciting than the pattern looks, and the reason why is the useful part.
What Closes below the lower Bollinger Band measures
Bollinger Bands start with a moving average of price — in the common setting, the 20-bar simple moving average — and place one band above it and one below it at a distance of 2 standard deviations of the last 20 closes. Standard deviation is simply a measure of how spread out recent closes have been. That means the bands breathe: they widen when the market is volatile and squeeze together when it is quiet. They are not a fixed envelope drawn at a fixed percentage.
So a close below the lower band says one thing precisely: this close sits further below the recent average than the recent spread of closes would usually produce. It is a statement about the recent distribution, nothing more. Traders read it in two opposite ways. The mean-reversion reading says price is stretched and should pull back toward the middle band. The momentum reading says a close outside the band is evidence that the regime has changed and that selling is accelerating. Both readings are popular, which is exactly why the event is worth counting rather than arguing about.
The test
We used Binance USDⓈ-M perpetual SOLUSDT candles on the 1H timeframe, from Sep 2020 to Oct 2026, a sample of 53686 bars. All timestamps are UTC.
The rule: a 1H close below the lower Bollinger Band (20-bar SMA − 2 standard deviations) after a close inside the bands. That "after a close inside" condition matters, because without it a long excursion outside the band would register dozens of times in a row. After an event, new events are ignored for 24 bars, so clusters inside the same move do not dominate the sample. Events are also split by whether the signal close was above or below the 200-bar EMA, as a simple read on the larger trend. That gave us 928 events.
Outcomes are measured from the close of the signal bar to the close 4 hours, 1 day and 3 days later, with 1 day as the main horizon. The baseline is every bar in the sample treated the same way — the outcome of an ordinary hour, chosen without any condition. That baseline is the only fair comparison: a market that drifts upward over years will make almost any signal look positive. These figures were calculated on historical prices; they are not actual trades. Fees and slippage are not included, which flatters every number below.
Results
What happened after the signal (close below the lower Bollinger Band)
| After | Events | Closed higher | Median move | Middle half (25th / 75th pct) | Worst | Baseline: closed higher | Baseline: median |
|---|---|---|---|---|---|---|---|
| 4 hours | 928 | 51.0% | +0.05% | -1.1% / +1.1% | -14.6% | 49.9% | +0.00% |
| 1 day | 928 | 50.0% | +0.00% | -2.8% / +2.8% | -35.7% | 49.6% | -0.03% |
| 3 days | 927 | 50.5% | +0.04% | -4.5% / +5.8% | -63.2% | 50.0% | +0.00% |
Calculated on historical prices; not actual trades. Fees and slippage not included.
At the main horizon, 50.0% of events closed higher one day later, against a baseline of 49.6%. The median move was +0.00%, against a baseline median of -0.03%. That is as close to nothing as a result can be. The 4-hour horizon is marginally friendlier to the mean-reversion story, 51.0% higher with a median of +0.05% versus 49.9% and +0.00%, and the 3-day horizon shows 50.5% versus 50.0%. The direction of the tilt is consistent, but the size of it is inside the noise you would expect from fewer than a thousand events.
The mean move of +0.33% at one day sits well above the median of +0.00%, which tells you the average is being pulled by a few large winners rather than by a typical outcome. The best case returned +41.6% and the worst -35.7%. The middle half of outcomes ran from -2.8% to +2.8%, so the usual result is a coin flip around flat with a wide spread.
The path is the part most readers underestimate. Within the day after the signal, the median worst dip was -3.16%, and 31.9% of events dipped more than 5% before the horizon closed. The median best rise within the same window was +2.97%. In other words, the typical event offered a bounce and a deeper drawdown of similar size, and roughly a third of them went through a drop most retail position sizes would feel.
By year (move after 1 day)
| Year | Events | Closed higher | Median move |
|---|---|---|---|
| 2020 | 44 | 43.2% | -1.48% |
| 2021 | 139 | 55.4% | +1.06% |
| 2022 | 163 | 44.2% | -0.59% |
| 2023 | 151 | 57.6% | +0.67% |
| 2024 | 152 | 50.0% | +0.12% |
| 2025 | 157 | 51.6% | +0.24% |
| 2026 | 122 | 42.6% | -0.34% |
Calculated on historical prices; not actual trades. Fees and slippage not included.
By year the picture is unstable, which is the honest headline. 2021 (55.4% higher, median +1.06%) and 2023 (57.6%, +0.67%) were kind to the pattern. 2020 (43.2%, -1.48%), 2022 (44.2%, -0.59%) and 2026 (42.6%, -0.34%) were not. Nothing here suggests a stable property of the market; it suggests the signal inherits whatever regime it fires in.
Split: close above vs below the 200-bar EMA (move after 1 day)
| Group | Events | Closed higher | Median move | Worst |
|---|---|---|---|---|
| Close above EMA 200 | 296 | 52.0% | +0.32% | -21.9% |
| Close below EMA 200 | 632 | 49.1% | -0.08% | -35.7% |
Calculated on historical prices; not actual trades. Fees and slippage not included.
The trend split points the same way. With the close above the 200-bar EMA, 296 events closed higher 52.0% of the time with a median of +0.32% and a worst case of -21.9%. With the close below it, 632 events produced 49.1% and a median of -0.08%, and the worst case deepened to -35.7%. Most band breaks happen in downtrends, and those are the ones that hurt.
Where it failed
The three worst outcomes cluster in known stress. On 2021-05-22 16:00 UTC the signal was followed by -35.7% over the next day, with a dip of -43.0% along the way. On 2021-05-19 04:00 UTC the one-day move was -21.9% and the dip reached -47.1% — the May 2021 crash, where a close below the band was the beginning of the move rather than the end. On 2022-11-07 22:00 UTC, during the FTX collapse, the result was -21.6% with a dip of -37.4%.
The pattern in those failures is the same: the band break happened while volatility was still expanding, so each new close kept redefining what "stretched" meant. The best cases share a mirror-image context. On 2021-02-22 10:00 UTC the move was +41.6% with a shallow dip of -9.0%, and on 2021-05-25 10:00 UTC it was +30.7% with a dip of only -2.4%, after the selling had already exhausted itself.
How to read it on your chart
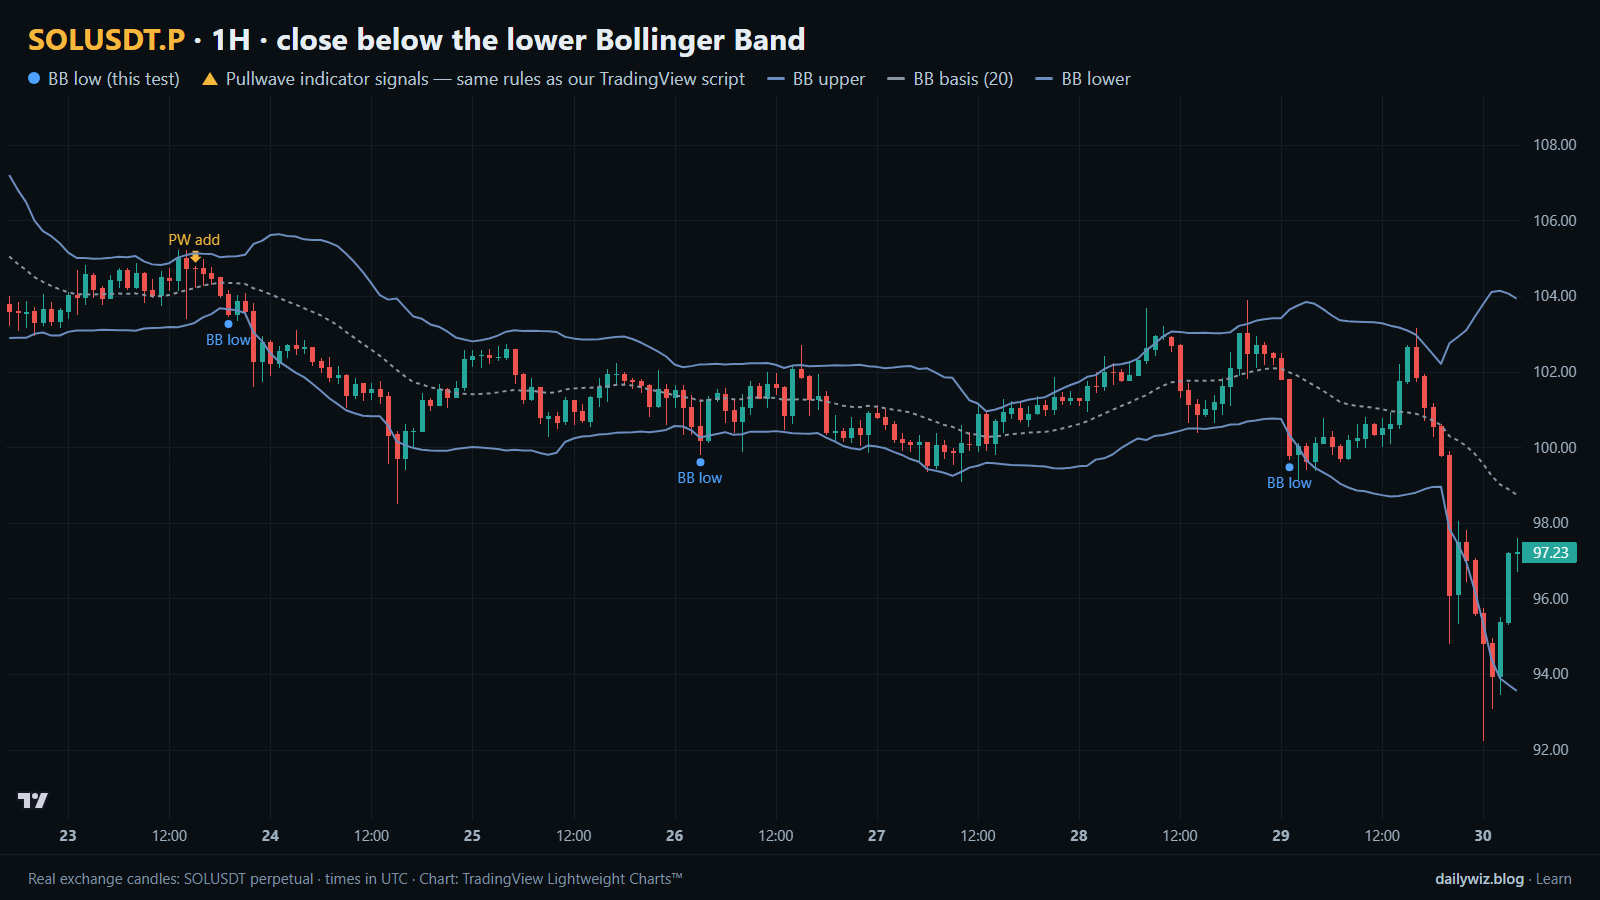
On the chart above, the blue dots mark the tested events and the three lines are the upper band, the 20-bar basis and the lower band. The window covers the last days of October 2026, and the outcomes there were -0.9%, -2.3%, 0.0% and -5.9% one day later — a fair sample of a signal with no edge in a weak stretch.
If you use this condition, consider treating it as context rather than a trigger. Three checks are cheap. First, where is price relative to the 200-bar EMA, since the split shows the downtrend group carries both the lower hit rate and the deeper worst case. Second, are the bands widening or already settling, because an expanding band means the distribution is still moving. Third, does the next bar close back inside the bands; a signal that never recovers the band is simply trend continuation. The event is invalidated, for mean-reversion purposes, when closes keep printing outside. And size for the path, not the outcome: a median worst dip of -3.16% is not an exception.
How the Pullwave indicator approaches this
Pullwave is an invite-only TradingView indicator. It is rule-based: fixed rules on price and volume, with no discretion left to the moment. Its futures version is built around SOL perpetual futures, and on the chart it marks long and short entries, add-ons, partial exits and exits, and it can send a TradingView alert when a mark prints. Its rules are not published, it does not predict the future, and it has losing trades. The user places any orders themselves; the indicator only draws marks and sends alerts.
The gold arrows on the chart above are Pullwave's marks on the same candles, taken from the public record on its site, under the same rules as the TradingView script. Compare them with the blue dots of the tested technique and notice that they answer different questions. The general idea a reader can take away is the useful one here: a single-condition trigger, like the band break we counted, is noisy on its own. A complete rule set also has to say when to add, when to take partial profit and when to exit.
Key takeaways
- Across 928 events on 1H SOLUSDT perpetual candles, 50.0% closed higher one day later against a baseline of 49.6%, with a median move of +0.00% — essentially no edge before costs.
- The shorter horizon is slightly friendlier (51.0% at 4 hours), but the tilt is small enough to be noise, and fees and slippage are not in these numbers.
- Context changed the result more than the signal did: above the 200-bar EMA, 52.0% and a median of +0.32%; below it, 49.1% and -0.08%, with a worst case of -35.7%.
- The path matters as much as the outcome: a median worst dip of -3.16% within the day, and 31.9% of events dipping more than 5%.
- If you use band breaks, consider them as a description of stretch inside a trend you have already judged, not as a standalone reason to act.
The gold arrows on the chart are marks from the Pullwave indicator for TradingView. See how the Pullwave indicator works on pullwave.net.
Chart rendered with TradingView Lightweight Charts™ from real exchange candles. tradingview.com