SOL 4H golden cross: trend start, or a signal that arrives late?
We tested 37 golden crosses on SOLUSDT 4H candles from Sep 2020 to Oct 2026. Three days out the signal did worse than a random bar; seven days out 62.2% closed higher, with deep dips along the way.
- Market
- SOLUSDT perpetual futures
- Timeframe
- 4H
- Data
- Sep 2020 – Oct 2026
- Sample
- 37 events
The golden cross is probably the most quoted signal in all of technical analysis: the 50-period average rises above the 200-period average, and headlines call it the start of a new uptrend. The objection is just as old. By the time a slow average crosses a slower one, the move that caused the cross already happened. So which is it on a fast, volatile asset like SOL when you run the test on 4-hour candles rather than daily ones?
We took every golden cross on SOLUSDT perpetual futures and measured what the price actually did afterwards, then compared it with what a randomly chosen bar would have given you over the same period. The answer is not a simple yes or no: the signal looks worse than nothing in the first few days and better than nothing after a week, and the path between those two points is rough enough to matter.
What Moving-average crossovers measures
A simple moving average is the average closing price of the last N bars, recalculated on every new bar. The 50-bar average reacts to recent price; the 200-bar average barely moves unless the market has trended for a long time. A crossover compares the two and turns the comparison into a single yes-or-no event: when the faster line pushes above the slower one, recent prices have been higher than the long-run average for long enough to drag the short average over it. The reverse cross is usually called a death cross.
What the indicator really measures is agreement between two time horizons. It says nothing about momentum strength, volume or where the price sits inside its range. Common settings are 50 and 200 for the classic version, 20 and 50 for a faster one, and 12 and 26 for the pair inside MACD. Traders typically read the cross as a regime label rather than a timing tool: above means the trend is up, below means it is down. Because both averages are built from past closes, the label always arrives after the fact. The question is how much after.
The test
Our data is Binance USDⓈ-M perpetual SOLUSDT candles on the 4H timeframe, from Sep 2020 to Oct 2026, 13415 bars in total. All timestamps are UTC.
The rule: the 50-bar SMA of the close crosses above the 200-bar SMA on a closed 4H bar. We only use closed bars, so there is no peeking at an unfinished candle. After an event we ignore new events for 42 bars, a cooldown that keeps a single choppy stretch of averages weaving around each other from flooding the sample with near-duplicate signals. That left 37 events over the whole period.
Outcomes were measured from the close of the signal bar to the close 3 days, 7 days and 21 days later, with 7 days as the main horizon. Alongside the result we recorded the deepest dip and the highest rise reached inside the main horizon, because the final number hides the path. As a baseline we did the same measurement starting from any bar in the dataset, which tells us what a coin-flip entry would have produced in the same market. These figures were calculated on historical prices; they are not actual trades. Fees, funding and slippage are not included, and on a real account they would subtract from every column.
Results
What happened after the signal (SMA 50 crosses above SMA 200)
| After | Events | Closed higher | Median move | Middle half (25th / 75th pct) | Worst | Baseline: closed higher | Baseline: median |
|---|---|---|---|---|---|---|---|
| 3 days | 37 | 48.6% | -1.29% | -5.7% / +3.6% | -14.2% | 50.1% | +0.02% |
| 7 days | 37 | 62.2% | +2.41% | -5.6% / +10.4% | -28.5% | 50.2% | +0.07% |
| 21 days | 37 | 59.5% | +5.44% | -9.5% / +18.5% | -66.6% | 50.3% | +0.11% |
Calculated on historical prices; not actual trades. Fees and slippage not included.
The three-day row is the honest part most golden cross articles leave out. Only 48.6% of events closed higher after 3 days, with a median of -1.29%, while a random bar closed higher 50.1% of the time with a median of +0.02%. In the first days after the cross, the signal was slightly worse than no signal at all. That is consistent with the common complaint: the cross prints after a run, and short-term pullbacks are frequent at exactly that point.
At 7 days the picture changes. 62.2% of events closed higher against a baseline of 50.2%, and the median move was +2.41% against +0.07%. That is a real gap, but note the spread: the middle half of outcomes ran from -5.6% to +10.4%, the best event gained +72.9% and the worst lost -28.5%. At 21 days, 59.5% closed higher with a median of +5.44%, and the worst case reached -66.6%. With only 37 events, a handful of large trends carry much of the mean of +3.82% at 7 days, which is why the median is the number to trust.
The path matters as much as the destination. The median worst dip inside the 7-day window was -6.58%, and 56.8% of events dipped more than 5% before the window ended. The median best rise inside the same window was +8.48%. In other words, even the events that ended green usually gave back something first, and a tight stop placed right at the cross would often have been taken out of a trade that later worked.
By year (move after 7 days)
| Year | Events | Closed higher | Median move |
|---|---|---|---|
| 2020 | 1 | 100.0% | +12.89% |
| 2021 | 4 | 50.0% | +0.55% |
| 2022 | 7 | 57.1% | +0.87% |
| 2023 | 8 | 37.5% | -4.85% |
| 2024 | 5 | 100.0% | +6.18% |
| 2025 | 6 | 50.0% | +0.90% |
| 2026 | 6 | 83.3% | +1.68% |
Calculated on historical prices; not actual trades. Fees and slippage not included.
By year the sample thins out fast, so read this as texture rather than evidence. 2023 produced 8 events with only 37.5% closing higher and a median of -4.85%, while 2024 produced 5 events that all closed higher. 2026 has 6 events with 83.3% higher but a modest median of +1.68%. The clustering tells you the signal inherits the year it lives in: in trending years it works, in range-bound or falling years it mostly does not.
Where it failed
The worst event in the sample fired on 2023-06-04 08:00 UTC and lost -28.5% over the week, after dipping -41.9% inside the window. The cross printed days before the US regulatory suits against major exchanges in early June 2023 hit the market; the averages described a recovery that the news erased.
The second worst fired on 2022-11-01 08:00 UTC, lost -14.9%, and dipped -25.1%. That cross landed in the days before the November 2022 FTX collapse, an event with a specific and heavy impact on SOL. The third, on 2022-12-15 08:00 UTC, lost -14.1% in the aftermath of the same shock, when averages crossed on a bounce inside a downtrend.
The pattern in all three is the same: the cross is a backward-looking confirmation, so it is at its weakest when the next piece of information has nothing to do with the last 200 bars. The best cases show the mirror image. The event on 2023-01-08 16:00 UTC gained +72.9% with a worst dip of only -0.1%, and the one on 2022-03-23 08:00 UTC gained +22.9% with a dip of -0.5%. When the cross marked a genuine turn, it barely looked back.
How to read it on your chart
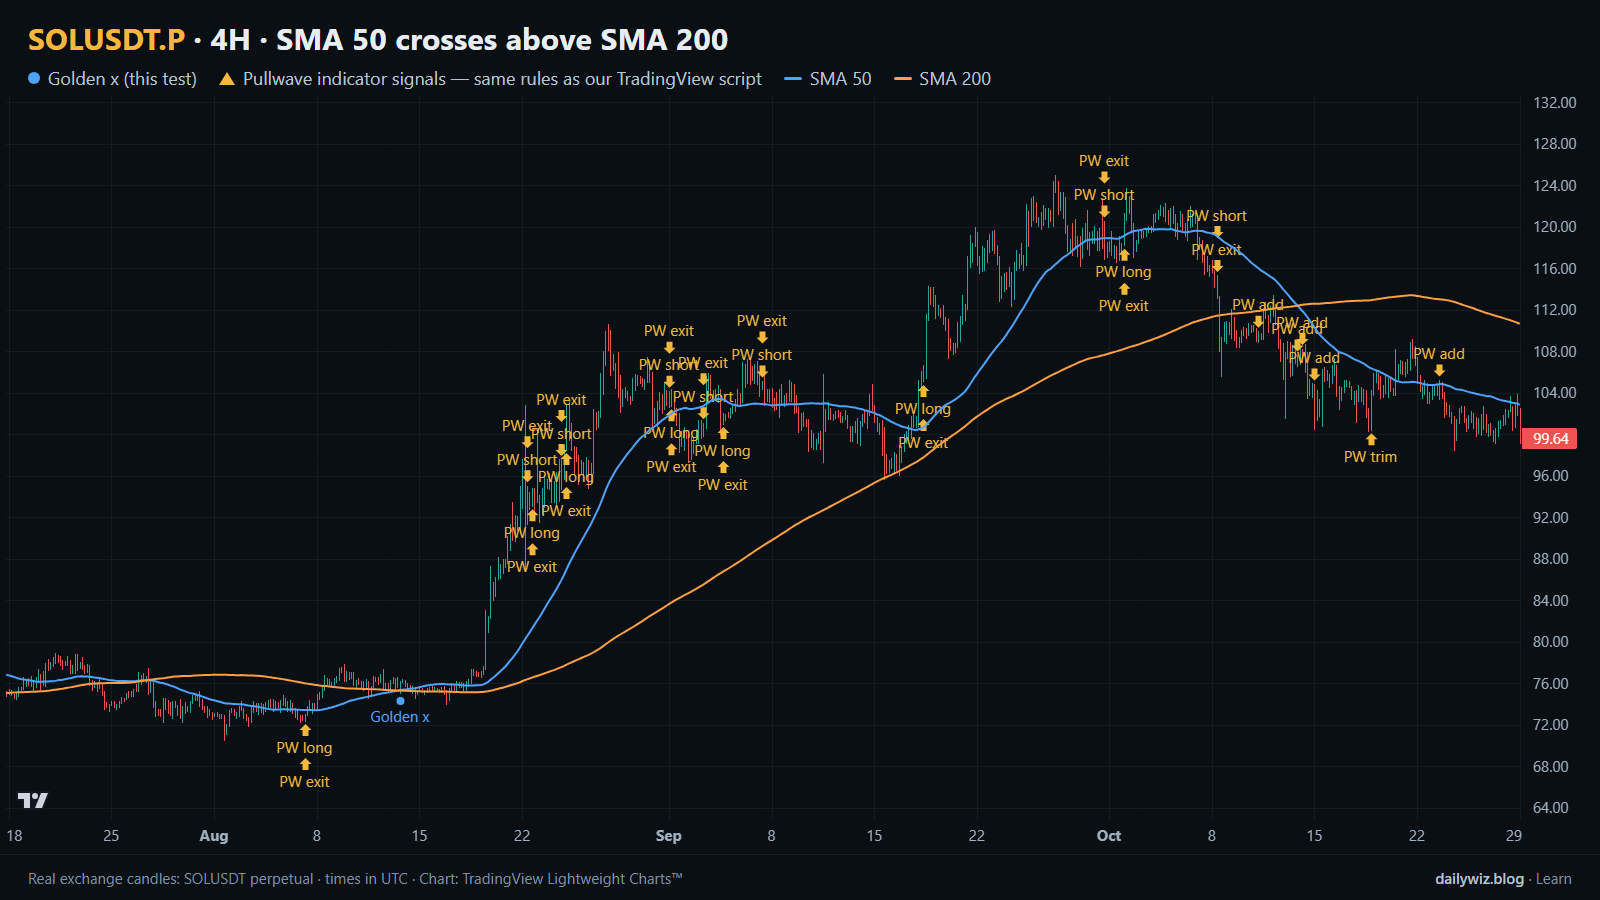
On the chart above, the blue dot marks the golden cross from our rule and the two lines are the SMA 50 and SMA 200 that produced it. Only 1 blue dot appears in the displayed window, which is a useful reminder of how rare this event is: 37 events in 13415 bars means you can go months without one.
If you use this signal, a few checks follow from the numbers. First, treat the days right after the cross as the weakest part, not the strongest; the 3-day row suggests nothing worth paying fees for. Second, size for the dip, not for the median: with 56.8% of events dipping more than 5% inside the week, a stop tighter than the usual noise will convert workable signals into losses. Third, look at what the 200-bar line is doing. The failures above were crosses into a falling long-term average; the successes were crosses where the slow line had flattened. Fourth, context outside the chart invalidates it quickly, as the 2022 and 2023 cases show. Recent events illustrate the ordinary case rather than the dramatic one: 2026-04-19 08:00 UTC ended +1.1%, 2026-07-01 12:00 UTC ended -0.9%, and 2026-08-13 16:00 UTC ended +14.6%.
How the Pullwave indicator approaches this
Pullwave is an invite-only TradingView indicator. It is rule-based: fixed rules on price and volume, with no discretion left to the user. On the chart it marks long and short entries, add-ons, partial exits and exits, and it can send a TradingView alert when a mark prints. The futures version is built around SOL perpetual futures; the spot version runs on major coins. Its rules are not published, it does not predict the future, and it has losing trades. The user places any orders themselves; the indicator only draws marks and sends alerts.
On the chart above, the gold arrows are Pullwave's marks on the same candles, taken from its public record, and you can compare their placement and frequency with the blue dots of the crossover rule tested here. The general idea a reader can take away is simple: a lone trigger like a moving-average cross is noisy by itself, while a complete rule set also has to answer when to add, when to take partial profit and when to exit.
Key takeaways
- Over 37 events on SOLUSDT 4H, the golden cross closed higher 48.6% of the time after 3 days, below the 50.1% baseline, so the immediate aftermath offered nothing.
- At the 7-day horizon the edge appeared: 62.2% higher with a median of +2.41%, against a baseline of 50.2% and +0.07%.
- The path was rough: median worst dip of -6.58% inside the week, and 56.8% of events dipped more than 5%.
- Results cluster by year, with 2023 showing a median of -4.85% and 2024 showing all 5 events higher, so the signal largely reflects the regime it fires in.
- If you use this, consider it a context filter rather than a timing trigger, and remember that fees and slippage are not in these figures.
The gold arrows on the chart are marks from the Pullwave indicator for TradingView. See how the Pullwave indicator works on pullwave.net.
Chart rendered with TradingView Lightweight Charts™ from real exchange candles. tradingview.com