BTC 4H: Is RSI Above 70 a Top Warning? 86 Signals Tested
We tested 86 RSI(14) crosses above 70 on BTC/USDT 4H candles. Three days later, 51.2% of them closed higher against a 52.7% baseline, so the overbought reading alone showed no clear edge.
- Market
- BTC/USDT spot
- Timeframe
- 4H
- Data
- Nov 2022 – Oct 2026
- Sample
- 86 events
Few readings cause as much disagreement as the relative strength index pushing above 70. One camp treats it as a warning: the move has gone too far, too fast, and a pullback is due. The other camp treats it as proof of strength: markets that reach overbought keep going, and selling into momentum is how you miss a trend. Both stories sound reasonable, and both are told with confidence after the fact.
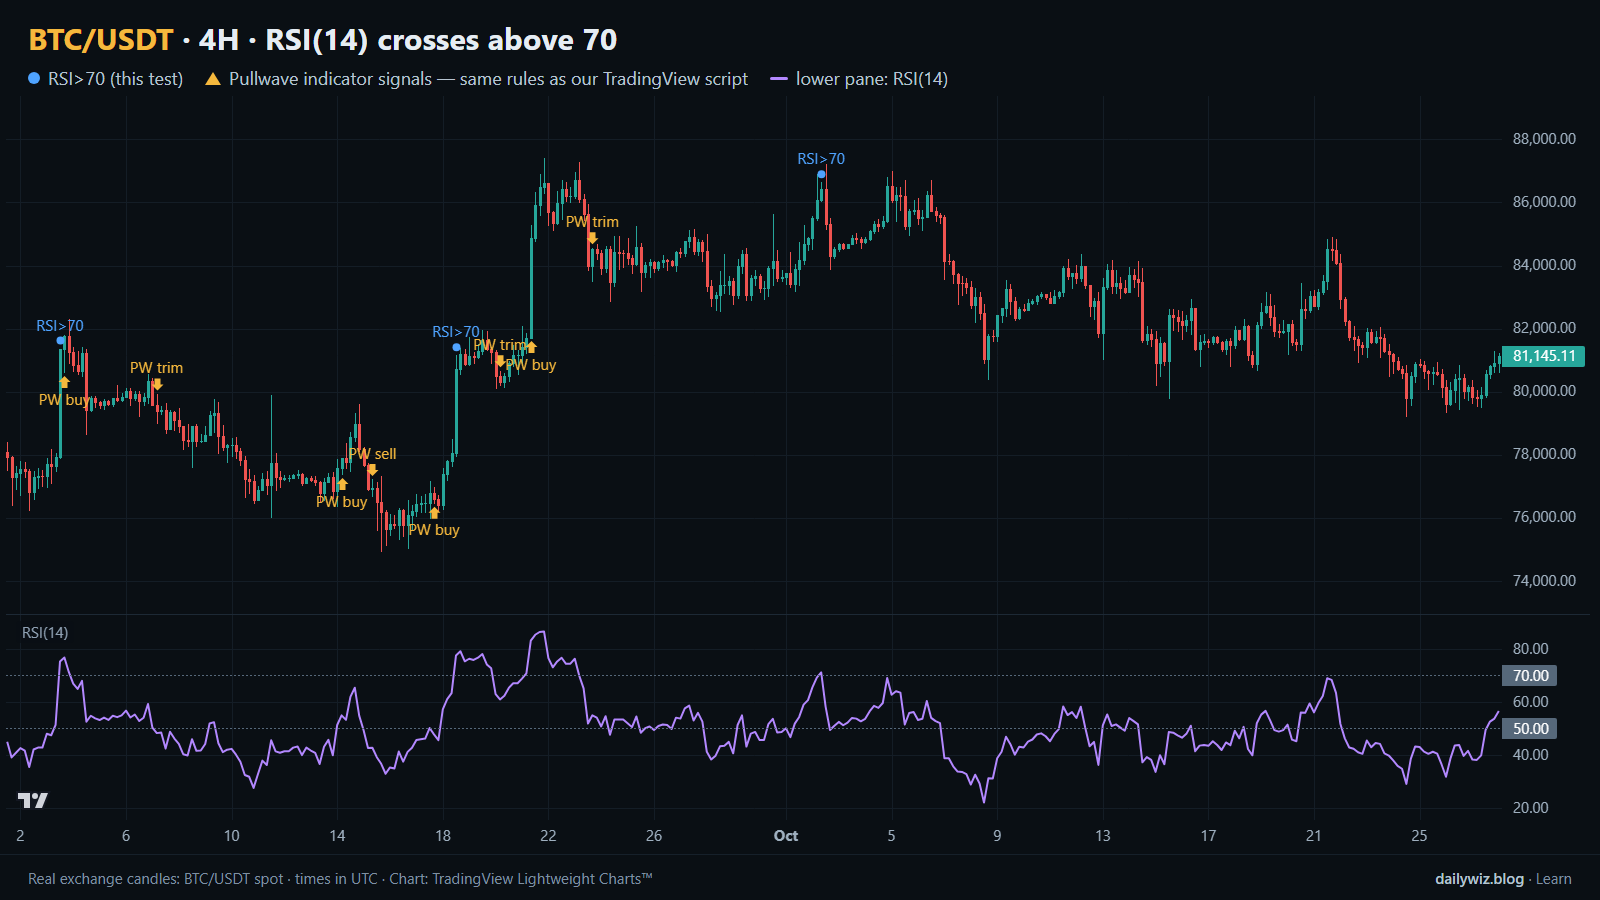
So we measured it. On BTC/USDT 4-hour candles, what actually happened in the days after RSI(14) first closed above 70? Did price stall more often than usual, run further than usual, or behave almost exactly like any other bar? The chart above shows the most recent window, with blue dots marking the events of the tested rule and the RSI(14) pane underneath.
What RSI overbought readings measures
The relative strength index compares the average size of up closes to the average size of down closes over a lookback window, then scales that comparison onto a range from 0 to 100. The standard setting is 14 bars. When recent closes have been mostly higher, and the up moves have been larger than the down moves, the index rises toward the upper end of its range. When losses dominate, it falls.
The usual reading is that values above 70 are overbought and values below 30 are oversold. It is important to see what that label does and does not claim. RSI does not know about support, liquidity, funding or news. It only summarizes the recent balance of up and down closes. A reading above 70 therefore means one thing with certainty: the last stretch of candles was strongly one-sided. Whether that one-sidedness ends soon or continues is a separate question, and it is the question we tested.
Traders use the reading in two opposite ways. Mean-reversion users fade it, expecting the move to cool. Trend users require it, treating the first push above 70 as confirmation that a new leg has started. The data can tell us which description fits BTC better over the test period.
The test
We used Binance BTC/USDT spot candles on the 4H timeframe, from Nov 2022 to Oct 2026, which is 8743 bars. All timestamps are UTC.
The rule is deliberately simple: RSI(14) closes above 70 after closing at or below 70 on the previous bar. That isolates the moment the reading first turns overbought, rather than counting every bar that stays there. After an event, new events are ignored for 18 bars, so one extended run does not flood the sample with near-duplicate signals. That left 86 events.
Outcomes were measured from the close of the signal bar to the close 1 day, 3 days and 7 days later, with 3 days as the main horizon. As a reference point we used the baseline of any bar in the same period, measured the same way, which answers the question "what would a randomly chosen moment have produced?" We also split events by whether the signal bar closed above or below the 200-bar EMA, to separate overbought readings inside an uptrend from overbought readings inside a downtrend.
These figures were calculated on historical prices; they are not actual trades. No fees or slippage are included, and real execution would shift the numbers.
Results
What happened after the signal (RSI(14) crosses above 70)
| After | Events | Closed higher | Median move | Middle half (25th / 75th pct) | Worst | Baseline: closed higher | Baseline: median |
|---|---|---|---|---|---|---|---|
| 1 day | 86 | 57.0% | +0.30% | -1.4% / +1.5% | -8.5% | 52.1% | +0.07% |
| 3 days | 86 | 51.2% | +0.63% | -2.1% / +3.8% | -7.7% | 52.7% | +0.19% |
| 7 days | 86 | 55.8% | +1.04% | -4.1% / +5.0% | -13.0% | 53.2% | +0.34% |
Calculated on historical prices; not actual trades. Fees and slippage not included.
The honest summary is that the overbought reading, on its own, did very little. At the 3-day horizon, 51.2% of events closed higher against a baseline of 52.7% — the signal was slightly worse than picking any bar at random. The median move of +0.63% was larger than the baseline median of +0.19%, which tells us the winners tended to be bigger, but the hit rate gives back whatever that suggests.
The 1-day window was the friendlier one: 57.0% closed higher versus a 52.1% baseline, with a median of +0.30%. At 7 days, 55.8% closed higher against 53.2%, with a median of +1.04% and a much wider spread, from a worst case of -13.0% to a best of +23.7%. Nothing here looks like a reliable top signal. If anything, the direction of the small tilt is mildly upward, which fits the trend-strength reading better than the exhaustion reading.
The path matters as much as the destination. Within the 3-day window the median worst dip was -2.13%, the median best rise was +2.97%, and 17.4% of events dipped more than 5% at some point. In other words, even the events that ended higher often shook first.
By year (move after 3 days)
| Year | Events | Closed higher | Median move |
|---|---|---|---|
| 2022 | 2 | 0.0% | -3.61% |
| 2023 | 23 | 56.5% | +1.10% |
| 2024 | 27 | 55.6% | +1.56% |
| 2025 | 17 | 41.2% | -0.25% |
| 2026 | 17 | 52.9% | +0.65% |
Calculated on historical prices; not actual trades. Fees and slippage not included.
By year, the picture is uneven rather than stable. 2023 and 2024 carried most of the sample and leaned positive, 2025 produced 17 events with only 41.2% closing higher and a median of -0.25%, and 2026 sat near the middle. A rule whose results flip sign between years is a rule whose edge is fragile.
Split: close above vs below the 200-bar EMA (move after 3 days)
| Group | Events | Closed higher | Median move | Worst |
|---|---|---|---|---|
| Close above EMA 200 | 77 | 51.9% | +0.66% | -7.7% |
| Close below EMA 200 | 9 | 44.4% | -2.82% | -7.3% |
Calculated on historical prices; not actual trades. Fees and slippage not included.
The trend split is the most useful cut, even though the second group is small. With the close above the 200-bar EMA, 77 events produced 51.9% higher and a median of +0.66%. With the close below it, 9 events produced 44.4% higher and a median of -2.82%. Nine events prove nothing on their own, but the direction matches intuition: an overbought reading inside a downtrend was the uncomfortable one.
Where it failed
The worst 3-day outcome came on 2025-01-06 12:00 UTC, which closed -7.7% lower and dipped -10.1% along the way. The signal appeared after a strong push, and the entire move was given back and more within three days.
Two more sit close behind. On 2026-03-04 12:00 UTC the result was -7.5% with a -8.1% dip, and on 2026-06-15 12:00 UTC it was -7.3% with a -7.4% dip, a case where price simply fell from the signal bar without first going higher. These cluster in the later, weaker part of the sample, which is also where the by-year table shows the thinner results.
The mirror cases are just as instructive. On 2023-06-20 12:00 UTC the move was +15.4% with a worst dip of only -0.3%, and on 2023-10-23 00:00 UTC it was +13.2% with a -1.2% dip. Same trigger, opposite outcome. The difference was context, not the indicator.
How to read it on your chart
If you use overbought readings, the test suggests treating them as a description of momentum rather than a trigger. Before trusting a blue dot like the ones on the chart above, consider checking where price sits relative to a long-term average such as the 200-bar EMA, because that split was the only cut in our data that separated the comfortable events from the painful ones.
Consider also what would invalidate the idea. If your reading is "the trend is strong," then a close back under the level that produced the signal, or a failure to make progress over the following bars, removes the reason to hold the view. If your reading is "a top is near," the recent cases show that price often kept rising for days afterward, so a plan built only on the overbought label needs an explicit exit.
Finally, size for the path, not the median. A median worst dip of -2.13% with 17.4% of events dipping more than 5% means that even a correct read can be uncomfortable to sit through.
How the Pullwave indicator approaches this
Pullwave is an invite-only TradingView indicator, published at pullwave.net, built on fixed rules applied to price and volume with no discretion. Its rules are not published, it does not predict the future, and it has losing trades. On the chart above, the gold arrows are Pullwave's marks on exactly the same candles, taken from the public record on its site, so you can compare them directly with the blue dots of the technique we tested.
The comparison is the lesson here. The blue dots come from a single condition, which is why they print whenever momentum turns one-sided, in good context and bad alike. Pullwave marks long and short entries, but also add-ons, partial exits and exits, and it can send a TradingView alert when a mark prints. The user places any orders themselves; the indicator only draws marks.
The general idea a reader can take away, with or without any tool, is that a single-condition trigger is noisy on its own. A complete rule set also has to answer when to add, when to take partial profit, and when to leave.
Key takeaways
- Across 86 events on BTC/USDT 4H, the 3-day hit rate of 51.2% sat below the 52.7% baseline, so the first push above 70 was not an edge by itself.
- The short horizon leaned slightly positive, with 57.0% higher after 1 day against a 52.1% baseline, which fits the trend-strength reading more than the top-warning reading.
- Context mattered more than the trigger: above the 200-bar EMA the median was +0.66%, below it the median was -2.82%, on only 9 events.
- Results flipped by year, including 41.2% higher in 2025, which is a sign of fragility rather than a stable pattern.
- If you use overbought readings, consider pairing them with trend context and a defined invalidation, and expect the path to be rough even when the outcome is positive.
The gold arrows on the chart are marks from the Pullwave indicator for TradingView. See how the Pullwave indicator works on pullwave.net.
Chart rendered with TradingView Lightweight Charts™ from real exchange candles. tradingview.com