ETHUSDT 1H: Does the Best RSI Setting Survive Out-of-Sample?
We tested 25 RSI dip settings on 53,933 ETHUSDT hourly candles. The best in-sample setting averaged +1.17% per trade before the split and -0.32% after it, ranking 14 of 25.
- Market
- ETHUSDT perpetual futures
- Timeframe
- 1H
- Data
- Sep 2020 – Oct 2026
- Sample
- 25 samples
Every backtest produces a winner. You test a grid of settings, sort the table by average return, and one row sits on top. The uncomfortable question is what that top row actually tells you: did you find a real behavior of the market, or did you just find the setting that happened to fit the noise in the sample you tested?
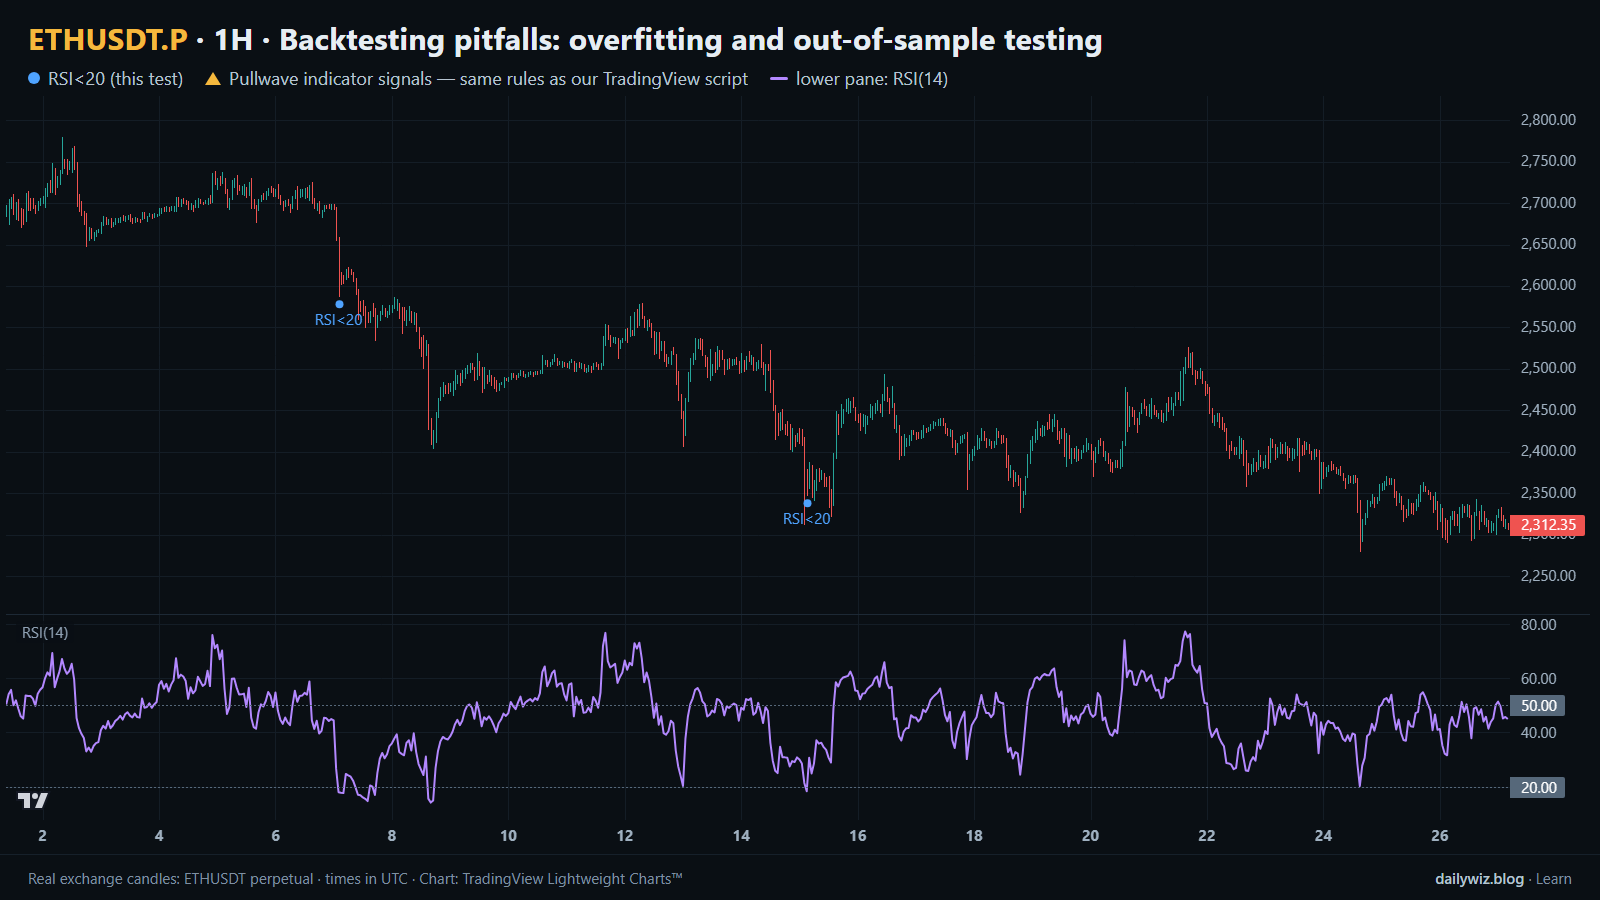
Today we answer that question with one concrete experiment on ETHUSDT. We took a very simple RSI dip rule, tried 25 variations of it on the first part of the data, picked the winner the way most people would, and then checked how that same winner behaved on the data that came afterward. The chart above shows the hourly candles with an RSI(14) pane below and blue dots where the strictest version of the trigger fired.
What Backtesting pitfalls: overfitting and out-of-sample testing measures
Overfitting is what happens when a rule is tuned so closely to one stretch of history that it describes that stretch instead of the market. It is not a programming error and it does not announce itself. The more settings you try, the more likely it is that one of them looks excellent purely by chance, especially when the number of trades behind it is small.
The standard defense is an out-of-sample split. You cut the data at a date, optimize only on the earlier part (in-sample), and then evaluate the chosen setting on the later part (out-of-sample) without touching it again. A common split is 60% in-sample and 40% out-of-sample, which is what we use here. The reading is simple in principle: if the setting keeps roughly the same character after the split, the result survives; if it collapses, the earlier number was mostly fitting.
Two supporting measures help. The first is the rank of the in-sample winner inside the out-of-sample table — a genuine edge should still be near the top, not buried in the middle. The second is the share of settings that are profitable in each half. If three quarters of a grid works before the split and almost nothing works after it, the grid was describing a past market regime rather than a durable pattern. Trading costs matter too, because a rule that only wins by a hair before fees stops winning the moment you charge for the round trip.
The test
We used Binance USDⓈ-M perpetual ETHUSDT candles on the 1H timeframe, from Sep 2020 to Oct 2026, 53,933 bars, all timestamps in UTC. The rule is deliberately plain: buy at the close when RSI(14) crosses below X, sell after H bars. We tested 25 settings in a grid, with X = 20, 25, 30, 35, 40 and H = 6, 12, 24, 48, 96 bars, and charged 0.1% per round trip.
The outcome of each event is measured from the close of the signal bar to the close H bars later, so a 24-bar hold is exactly one day of hourly candles. A crossing only counts when RSI comes from above the threshold, which acts as a natural cooldown: a long stretch below the level produces one event, not one per bar. The split date is 2024-05-11, with everything before it treated as in-sample and everything from that date onward as out-of-sample.
As a baseline we normally compare against the average move after any bar; here the more useful reference is the median of all 25 settings in each half, because the question is not whether one rule beats a coin flip but whether the chosen rule keeps its advantage over its own peers. These figures were calculated on historical prices; they are not actual trades. Beyond the 0.1% round trip stated in the rule, no additional fees or slippage are included, and real fills would differ.
Results
In-sample (before 2024-05-11) vs out-of-sample (from 2024-05-11), average trade after a 0.1% round-trip cost
| Setting | In-sample trades | In-sample avg trade | In-sample win share | Out-of-sample trades | Out-of-sample avg trade | Out-of-sample win share | |
|---|---|---|---|---|---|---|---|
| Best in-sample setting | RSI < 20, hold 4 days | 48 | +1.17% | 50.0% | 38 | -0.32% | 50.0% |
| Best out-of-sample setting (hindsight) | RSI < 35, hold 4 days | 209 | +1.03% | 56.5% | 144 | +0.15% | 53.5% |
| Median of all settings | 25 settings | +0.15% | -0.24% |
Calculated on historical prices; not actual trades. Fees and slippage not included.
The in-sample optimizer picked RSI < 20, hold 4 days: the deepest threshold in the grid and one of the longest holds, averaging +1.17% per trade on 48 in-sample events. That is the row you would have written down in May 2024 if you had run this study then.
After the split, the same setting averaged -0.32% per trade across 38 events, and it ranked 14 of 25 in the out-of-sample table — the middle of the grid, not the top. The win share stayed at 50.0% in both halves, which is a useful detail: the rule did not suddenly start losing more often, the size of the winners simply stopped covering the losers and the cost.
The grid-wide numbers are blunter. In-sample, 76.0% of the 25 settings produced a positive average trade. Out-of-sample, 8.0% did. The median setting went from +0.15% to -0.24%. When almost every variation of a rule works in one period and almost none works in the next, the honest conclusion is that the first period, not the rule, was doing the work.
The third row of the table is the hindsight check. The best out-of-sample setting, RSI < 35, hold 4 days, was also strong in-sample at +1.03% over 209 trades, but it only averaged +0.15% out-of-sample over 144 trades, with the win share drifting from 56.5% to 53.5%. Even the best available answer after the fact is thin once the round trip is paid.
Where it failed
There is no single dramatic date to point at here, and that is the lesson. The failure was not one catastrophic trade; it was a slow, distributed erosion. The chosen setting kept winning half its trades after 2024-05-11 and still ended up below zero, which is the signature of an edge that lived in the size of the moves rather than in their direction.
The deepest threshold is also the most fragile one. RSI < 20 produced only 48 in-sample events across years of hourly data, so a handful of unusually strong rebounds was enough to lift the average to +1.17% and push that row to the top of the grid. A sample that small cannot distinguish a real asymmetry from a lucky sequence. The looser threshold, with 209 in-sample trades, moved far less between halves — still weaker out-of-sample, but it did not flip sign. Fewer events means a louder-looking result and a less reliable one.
How to read it on your chart
On the chart above, the blue dots mark the strict RSI(14) crossings below 20 in a recent hourly window, with the indicator pane beneath the candles. Notice how rare they are. If you are building a rule around a trigger this selective, the first thing to check is how many events the backtest is actually built on, not how good the average looks.
If you use optimization, consider holding a slice of data back before you look at any results, and judge a setting by its rank in the untouched half rather than by its in-sample average. A setting that drops to the middle of the grid after the split, as this one did, should be treated as unconfirmed. It also helps to look at the neighbors: if 20 works brilliantly and 25 does not, the surface is spiky and the choice is probably noise. Finally, charge costs from the start. A 0.1% round trip is small, but it is exactly the margin that separates the median setting here from flat.
How the Pullwave indicator approaches this
Pullwave is an invite-only TradingView indicator that follows fixed rules on price and volume, with no discretion. On the chart it marks long and short entries, add-ons, partial exits and full exits, and it can send an alert when a mark prints. Its rules are not published, it does not predict the future, and it has losing trades.
The gold arrows on the chart above are Pullwave's marks on the same candles, taken from the public record on pullwave.net. Compare them with the blue dots of the technique tested here. A single-condition trigger like this one is noisy on its own; a complete rule set also has to answer when to add, when to take partial profit and when to step aside. Any orders are placed by the user; the indicator only draws marks and sends alerts.
Key takeaways
- On ETHUSDT 1H, the best in-sample setting (RSI < 20, hold 4 days) averaged +1.17% before 2024-05-11 and -0.32% after it, ranking 14 of 25 out-of-sample.
- The share of profitable settings fell from 76.0% in-sample to 8.0% out-of-sample, and the median setting went from +0.15% to -0.24%.
- Small samples produce the loudest results: the winning row rested on 48 trades, while the looser threshold with 209 trades was far more stable.
- If you optimize, consider reserving untouched data in advance and judging a setting by its out-of-sample rank, not by its in-sample average.
- Include costs from the first test; a 0.1% round trip is enough to decide several of these rows.
The gold arrows on the chart are marks from the Pullwave indicator for TradingView. See how the Pullwave indicator works on pullwave.net.
Chart rendered with TradingView Lightweight Charts™ from real exchange candles. tradingview.com