SOL Chart Note — Nov 10: Trend Filter Down, Price at $86.66
SOLUSDT.P trades at $86.66 with the Pullwave 1H trend filter in a DOWN state and its trend line sitting at $92.80. Levels, state and news for Nov 10.
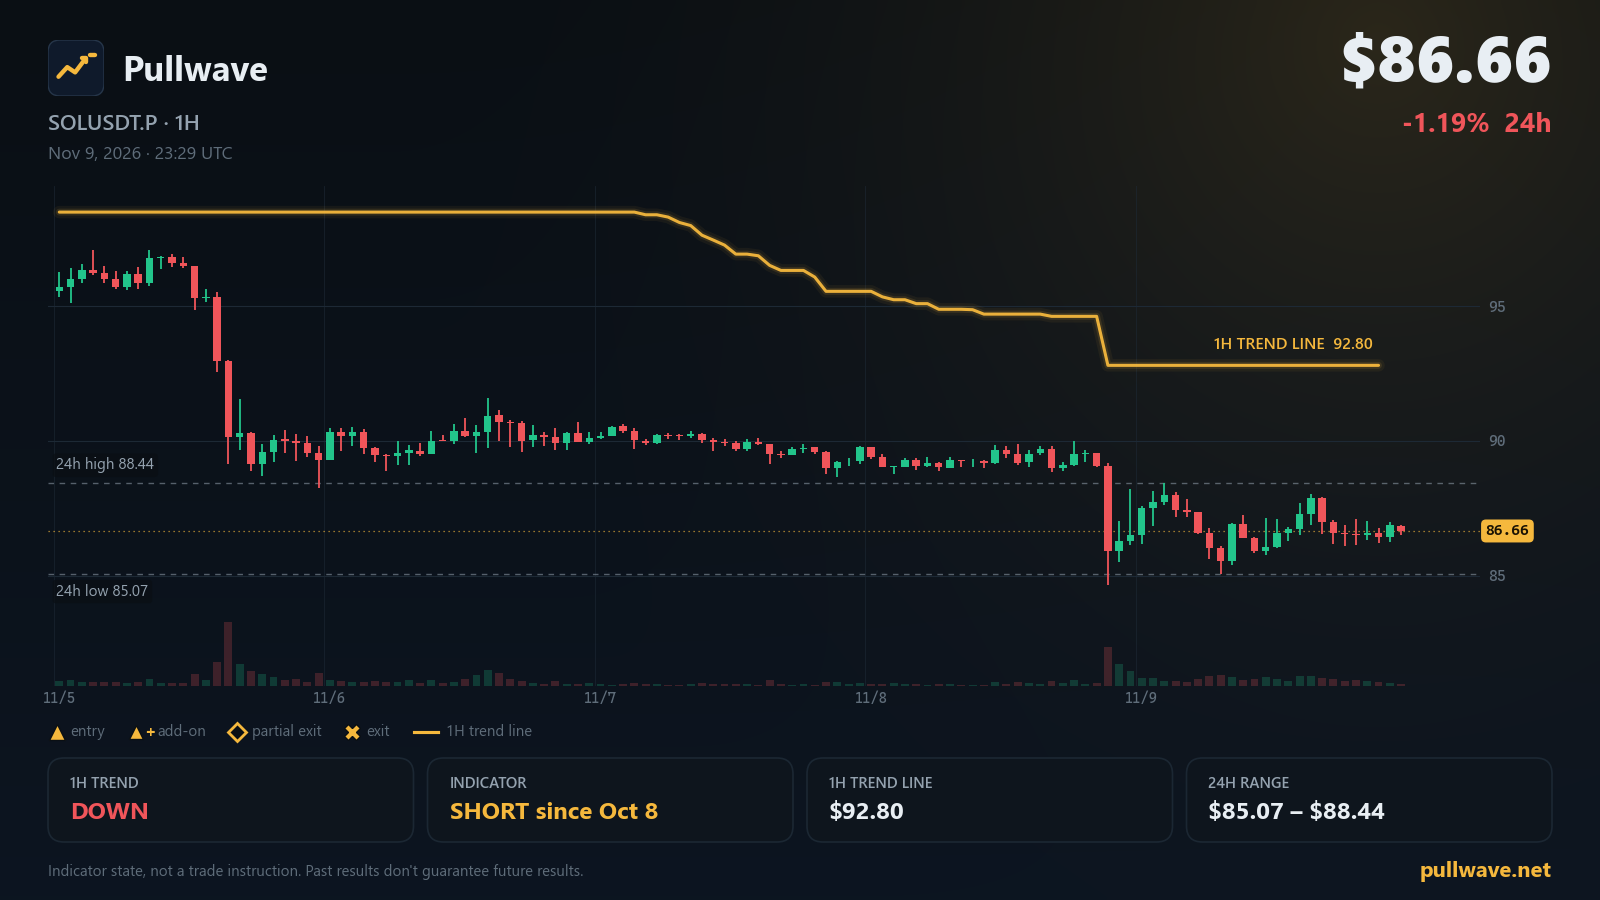
Key levels
- 7-day high98.16
- Indicator 1H trend line92.80A 1H close beyond this line flips the indicator's 1H trend filter.
- 24h high88.44
- 24h low85.07
- 7-day low84.66
- 1H trend
- Down
- Indicator position
- Short since Oct 8
- Last indicator event
- Add-on (short) · 95.78 · Oct 31
- 1H trend line
- 92.80
SOL is starting the session quietly, with the perpetual market holding under the week's upper range after a soft 24 hours. The Pullwave CYH Pullback Strategy remains in a short state on SOLUSDT.P, and its 1H trend filter has not flipped. Below is the plain-language rundown of where price sits, what the indicator is currently showing, and which chart levels frame the day.
Market snapshot
SOL USDⓈ-margined perpetual futures (SOLUSDT.P) last printed $86.66, a 24h change of -1.19%. The 24h range runs from a low of $85.07 to a high of $88.44, so the last day has been a narrow one compared with the wider weekly picture: the 7-day high is $98.16 and the 7-day low is $84.66. That puts current price in the lower half of the weekly range, closer to last week's floor than its ceiling.
Positioning data is mild. The latest funding rate reads 0.0098%, and open interest stands at 9,606,298 SOL (about $833M), up +4.45% over 24 hours. So while price drifted lower on the day, the amount of open exposure in the market grew rather than shrank — a combination worth keeping an eye on as the 24h extremes get tested.
What the Pullwave indicator shows
The Pullwave CYH Pullback Strategy is built from fixed price-and-volume rules — no discretionary input and no machine learning. It works in two layers. The first is a 1H trend filter: a volatility-based trailing line plotted on the 1-hour chart that classifies the backdrop as either up or down. The second layer is 15m execution, which looks for pullbacks that develop inside that established trend.
Right now the 1H trend filter is DOWN, and the indicator's position state is SHORT, held since Oct 8, 11:00 UTC. The trailing trend line currently sits at $92.80. Because the line trails, it only changes classification on a 1H candle close on the other side of it — intrabar pokes do not count. If a 1H candle closes above $92.80, the indicator's trend filter would flip to UP.
The most recent event on the chart was an add-on entry (short) at Oct 31, 20:00 UTC, near $95.78. An add-on entry is simply what the indicator prints when price pulls back against the prevailing direction and then resumes it — the script marks an additional entry label on the chart rather than opening a brand-new trade in the opposite direction. The counterpart is a partial exit: when a move extends, the indicator marks a portion of the position as closed and leaves the remainder running, which is why you may see exit labels appear while the position state still reads short.
Everything the indicator does is drawn on the chart — entries, add-ons, exits, plus an add-on conditions table — and alerts can be configured. Order placement is always done by the user. Displaying the indicator works on TradingView's free plan; creating alerts requires a paid plan (Essential or higher).
Key levels on the chart
- $98.16 — 7-day high
- $92.80 — Indicator 1H trend line
- $88.44 — 24h high
- $85.07 — 24h low
- $84.66 — 7-day low
With last price at $86.66, the nearest references are $88.44 above and $85.07 below, with the weekly floor at $84.66 sitting just underneath that.
Solana ecosystem and official updates
Network status on status.solana.com reads All Systems Operational.
Solana Breakpoint 2026 Adds Revolut Chair, Former Prime Minister, Former Chancellor and City Leaders to London Lineup — October 26, 2026. The Solana Foundation announced more Breakpoint 2026 speakers on October 27, including Revolut Chair Martin Gilbert, former Chancellor Sajid Javid, and former Prime Minister Boris Johnson. The event takes place 15–17 November at Olympia London. (solana.com)
Firedancer Mainnet Release v26.10.6 — November 5, 2026. Firedancer released mainnet-ready version v26.10.6, adding support for the loaderv3_programdata_size_floor feature. (Firedancer (GitHub))
What to watch next
A few conditional observations, framed only around the levels listed above:
- The trend line at $92.80 is the single state-defining level. As long as 1H candles close below it, the indicator's trend filter stays DOWN. A 1H close above $92.80 would flip it to UP, which would also change the context the 15m execution layer works in.
- $88.44 and $85.07 bracket the session. Price at $86.66 sits between them. Trade acceptance above the 24h high or below the 24h low would widen the day's range before the weekly markers come into play.
- $84.66 is the weekly floor. It sits just below the 24h low, so the two are close enough that a break of one brings the other into immediate focus.
- $98.16 caps the week. It remains well above both current price and the trend line, so it is only relevant if the market first reclaims the $92.80 area on a closing basis.
Also worth noting: open interest rose +4.45% over the past 24 hours while price slipped -1.19%. That mix tends to make the reaction at the 24h extremes more informative than usual, so the behaviour of 1H closes around $88.44 and $85.07 is the practical thing to observe today.