SOL Chart Note — Nov 9: 1H Trend Filter Still Down
SOL trades at $87.44 after a -2.20% day. The Pullwave indicator holds a short state with its 1H trend line at $92.80.
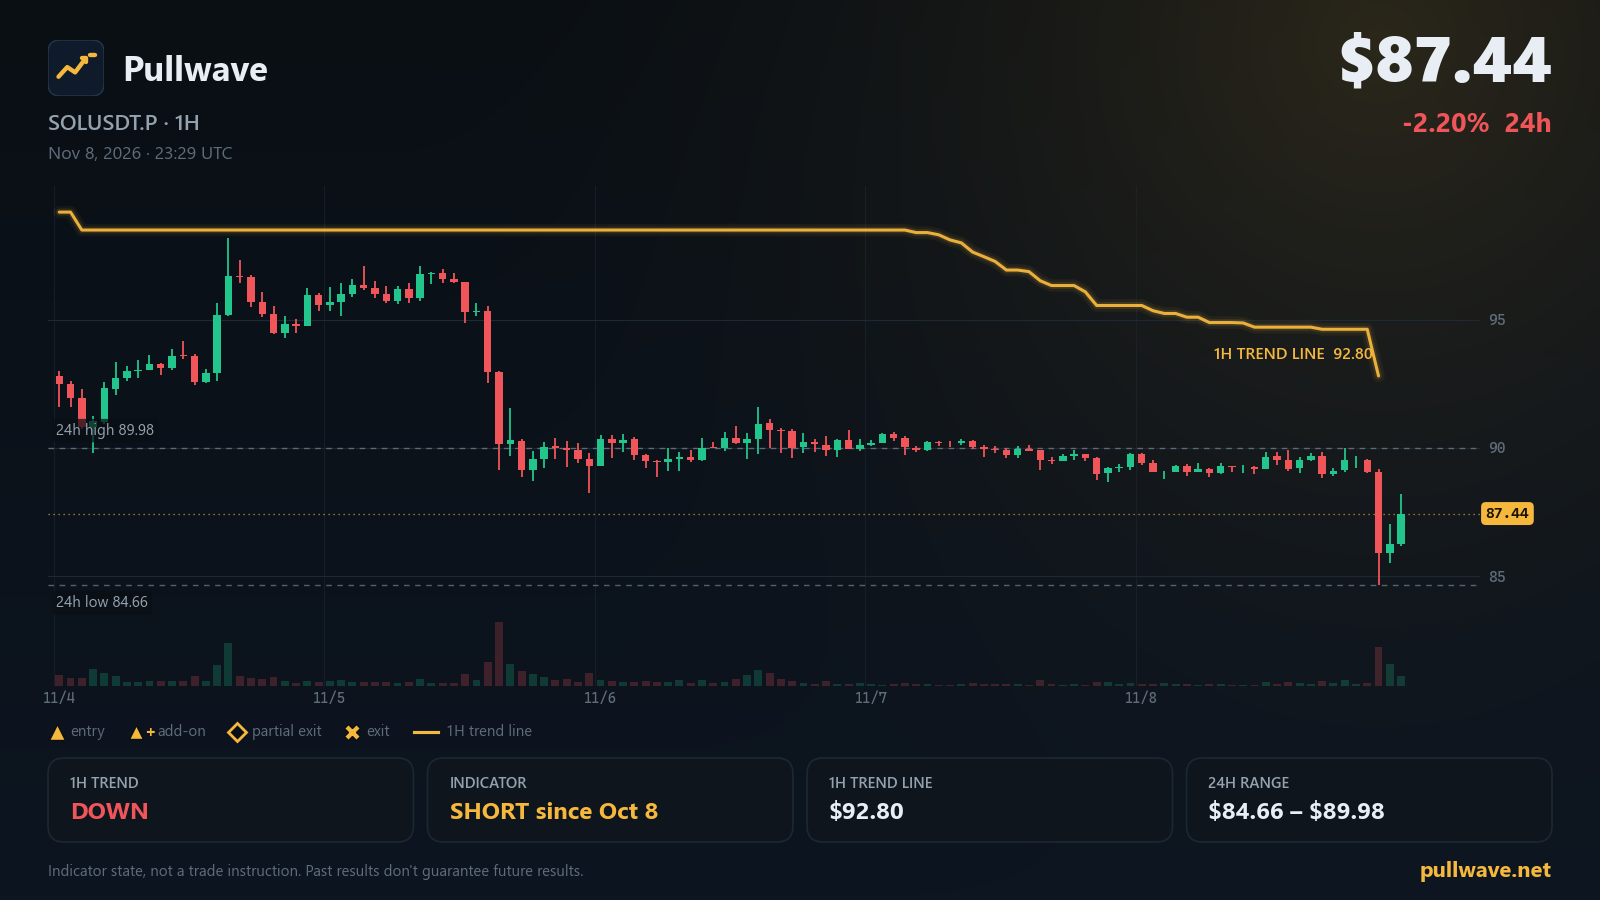
Key levels
- 7-day high98.16
- Indicator 1H trend line92.80A 1H close beyond this line flips the indicator's 1H trend filter.
- 24h high89.98
- 24h low84.66
- 1H trend
- Down
- Indicator position
- Short since Oct 8
- Last indicator event
- Add-on (short) · 95.78 · Oct 31
- 1H trend line
- 92.80
SOL is trading at $87.44 on the USDⓈ-margined perpetual (SOLUSDT.P), down -2.20% over the last 24 hours. The Pullwave CYH Pullback Strategy is still showing a short state on the chart, with its 1H trend filter pointing down. Here is how today's chart reads, level by level.
Market snapshot
The last price on SOLUSDT.P is $87.44, a -2.20% change over 24 hours. The session has ranged between a 24h high of $89.98 and a 24h low of $84.66, and that low is also the 7-day low, so price is sitting at the bottom edge of the weekly range. The 7-day high stands at $98.16, which marks the upper boundary of the past week.
Funding on the perpetual is at -0.0029%, a slightly negative reading. Open interest is 9,175,277 SOL, roughly $802M, and it has moved -1.60% over the past 24 hours. On the network side, status.solana.com reports All Systems Operational.
What the Pullwave indicator shows
The Pullwave CYH Pullback Strategy is an invite-only TradingView indicator built for SOLUSDT.P on the 30m and 15m charts. Its signals come from fixed price-and-volume rules — there is no discretion and no machine learning behind the plots.
The indicator has two layers. The first is a 1H trend filter: a volatility-based trailing line drawn on the 1-hour chart. The line sits above price when the filter reads down and below price when it reads up, and it only changes side when an hourly candle closes on the other side of it. That makes it slow by design — it ignores intraday noise and only reacts to hourly closes. The second layer is 15m execution: once the trend filter has a direction, the indicator looks for pullbacks against that direction on the 15-minute chart and marks entries there.
Two other marker types appear on the chart. An add-on entry is plotted when price pulls back inside an existing trend and the indicator's conditions line up again — it adds to the position already shown on the chart, in the same direction. A partial exit is plotted when the move extends, taking part of the shown position off rather than closing it all at once. An add-on conditions table on the chart tracks which of those conditions are currently met, and alerts can be attached to any of these events.
As of this morning:
- 1H trend filter: DOWN
- Indicator position state: SHORT, held since Oct 8, 11:00 UTC
- Latest indicator event: an add-on entry (short) at Oct 31, 20:00 UTC, near $95.78
- 1H trend line: $92.80
The indicator has therefore been on one side of the market for about a month of chart time, with one add-on marker printed at the end of October. Displaying the indicator works on TradingView's free plan; creating alerts from its events needs a paid TradingView plan (Essential or higher).
Key levels on the chart
- $98.16 — 7-day high
- $92.80 — Indicator 1H trend line
- $89.98 — 24h high
- $84.66 — 24h low
Solana ecosystem and official updates
Solana Changelog: November 5, 2026 — November 5, 2026. Solana's weekly changelog reports Rolldown cutting Web3.js bundle time from 2 seconds to nearly zero, alongside updates to Agave, Firedancer, Anchor, and Surfpool, plus a new ISA vector intrinsics proposal. solana.com
Solana Community Awards 2026: Meet the Finalists — November 3, 2026. The Solana Community Awards feature 48 finalists across 12 community-voted awards. Voting closes November 9, and the ceremony streams live from London on November 13. solana.com
Firedancer Mainnet Release v26.10.6 — November 5, 2026. Firedancer released mainnet-ready version v26.10.6, adding support for the loaderv3_programdata_size_floor feature. Firedancer (GitHub)
What to watch next
The single most mechanical thing on this chart is the trend line itself. If a 1H candle closes above $92.80, the indicator's trend filter would flip to up, and the short state currently drawn on the chart would no longer have the 1H filter behind it. As long as hourly closes stay below $92.80, the filter stays down and the 15m layer keeps looking for pullbacks in that same direction.
Between price and that line sit two nearer markers. The 24h high at $89.98 is the first reference above the last price of $87.44; the 7-day high at $98.16 sits above the trend line and marks the far edge of the weekly range. On the downside, $84.66 is both the 24h low and the 7-day low, so a move through it would put price below the whole week's traded range — a condition that would also be visible as new lows on the 15m execution chart.
Also worth noting: funding at -0.0029% and the -1.60% move in open interest describe current positioning conditions only, and the Pullwave indicator does not read either of them. Its rules are price and volume based, so what matters for its state is where the hourly candles close relative to $92.80.