SOL Chart Note — Oct 28: Pullwave Short Under $106.83
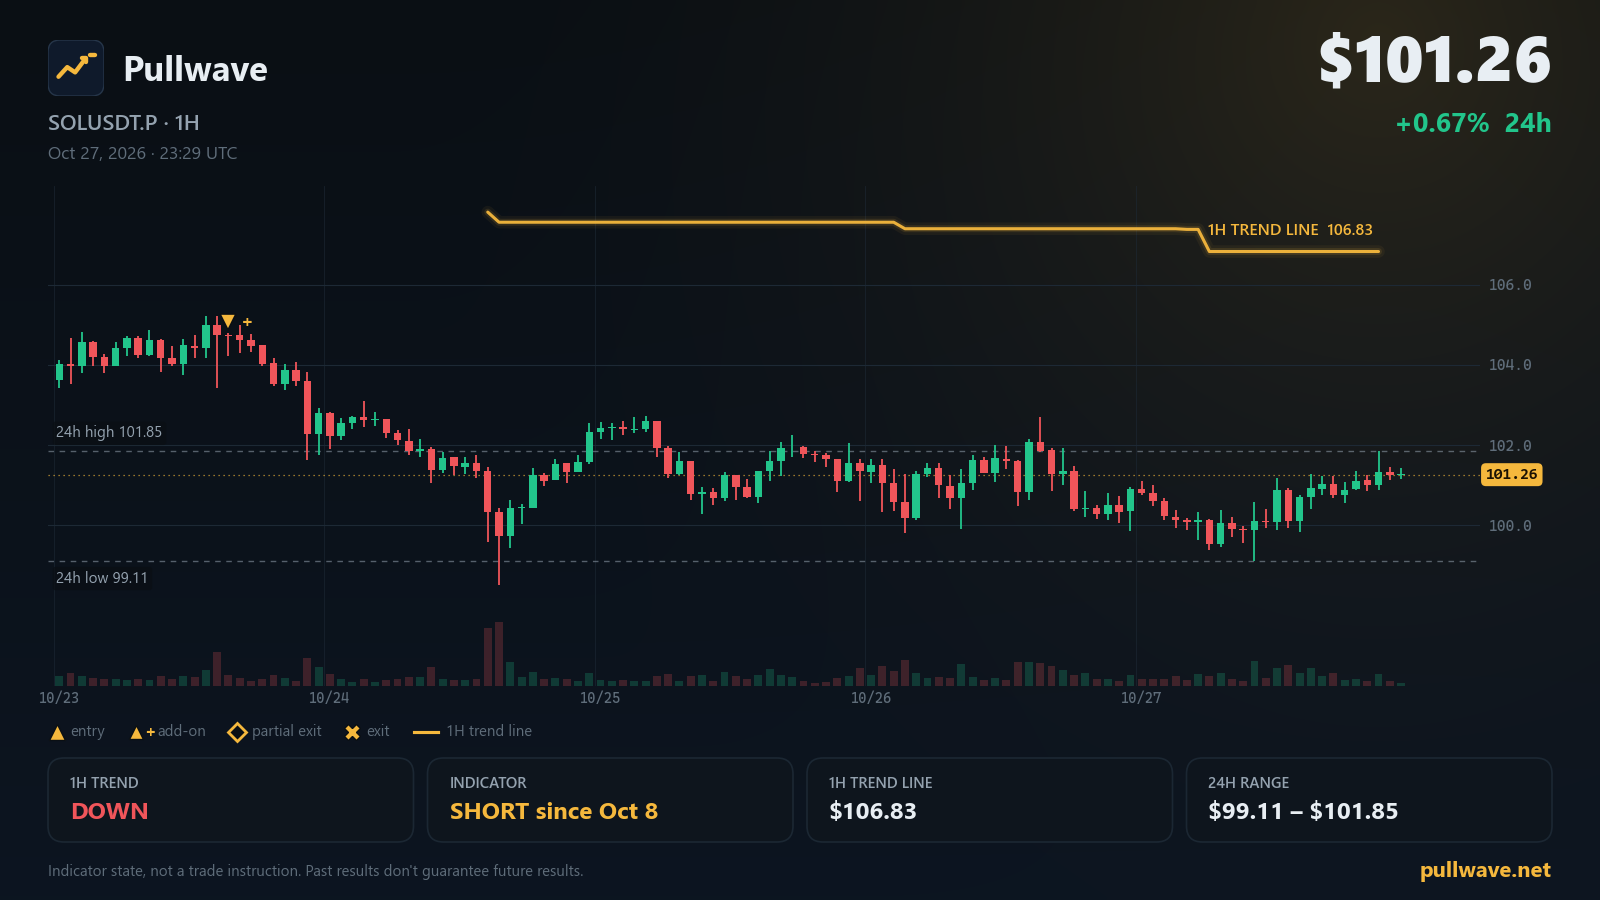
SOL trades at $101.26 with the Pullwave 1H trend filter down and the trend line at $106.83. Key levels, indicator state and Solana updates for Oct 28.
Key levels
- 7-day high109.18
- Indicator 1H trend line106.83A 1H close beyond this line flips the indicator's 1H trend filter.
- 24h high101.85
- 24h low99.11
- 7-day low98.51
- 1H trend
- Down
- Indicator position
- Short since Oct 8
- Last indicator event
- Add-on (short) · 104.34 · Oct 23
- 1H trend line
- 106.83
SOL is holding a narrow band near the lower half of its weekly range while the Pullwave CYH Pullback Strategy remains in a short state on SOLUSDT.P. The 1H trend filter is still pointing down, and the chart is sitting in a pullback phase inside that downtrend. Below is today's read of the levels, the indicator state and the official Solana updates from the past few days.
Market snapshot
SOL USDⓈ-margined perpetual futures (SOLUSDT.P) last traded at $101.26, a 24h change of +0.67%. The session range has been tight: the 24h high is $101.85 and the 24h low is $99.11, both sitting well inside the weekly band defined by the 7-day high at $109.18 and the 7-day low at $98.51.
The latest funding rate is 0.0100%. Open interest stands at 9,072,129 SOL, roughly $919M, up +2.09% over 24 hours — so positioning has grown slightly while price has barely moved, which is typical of a compressed range.
What the Pullwave indicator shows
The Pullwave CYH Pullback Strategy works on two timeframes. The 1H trend filter is a volatility-based trailing line drawn on the 1H chart: when price closes on one side of that line, the filter holds a direction and the strategy only looks for setups in that direction. Execution itself happens on the 15m chart, where entries, add-on entries and exits are plotted directly as labels.
As of this morning, the 1H trend filter reads DOWN, and the indicator has been in a short state since Oct 8, 11:00 UTC. The 1H trend line currently sits at $106.83 — a 1H close above that line would flip the trend filter to up. Until that happens, the filter stays on the down side regardless of intraday bounces.
The most recent indicator event was an add-on entry (short) on Oct 23, 15:15 UTC, near $104.34. An add-on entry on this strategy is simply a second marker printed in the same direction as the existing position after price pulls back inside the prevailing trend; it is a chart event, not an instruction. The strategy also plots partial exits when a move extends, meaning part of the position is marked as closed while the rest of the structure stays on the chart. All of these markers come from fixed price-and-volume rules, not from any adaptive or learning model.
Right now the 1H structure is labelled as a pullback phase inside the downtrend — price recovering within a trend the filter still reads as down.
Key levels on the chart
- $109.18 — 7-day high
- $106.83 — Indicator 1H trend line
- $101.85 — 24h high
- $99.11 — 24h low
- $98.51 — 7-day low
Solana ecosystem and official updates
Network status on status.solana.com currently reads All Systems Operational.
Solana Breakpoint 2026 Adds Revolut Chair, Former Prime Minister, Former Chancellor and City Leaders to London Lineup — Oct 26, 2026. The Solana Foundation announced additional speakers for Breakpoint 2026, taking place 15-17 November at Olympia London, including Revolut Chair Martin Gilbert, former UK Prime Minister Boris Johnson, former Chancellor Sajid Javid, and leaders from Zelle, DTCC, Mastercard, Backpack, and Bitwise. solana.com
Release v4.4.0-rc.1 — Oct 26, 2026. Agave v4.4.0-rc.1 is a mainnet-beta upgrade candidate release recommended for 10% adoption, and is also recommended for Testnet and Devnet. Anza Agave (GitHub)
Firedancer Mainnet Release v26.10.5 — Oct 27, 2026. Firedancer v26.10.5 is a mainnet-ready release with improved snapshot download peer selection, better block packing performance, a fix for a rare validator crash at the epoch boundary, and improved connection reliability for voting validators. Firedancer (GitHub)
What to watch next
The cleanest reference on the chart is the 1H trend line at $106.83. If a 1H candle closes above it, the indicator's trend filter would flip to up, and the short state shown since Oct 8 would no longer be supported by the filter. As long as 1H closes stay under that line, the filter remains down and the current pullback phase stays intact on the indicator's reading.
Between here and there sits the 24h high at $101.85, which caps the current session, and the 7-day high at $109.18 further above. On the downside, the 24h low at $99.11 is the first reference from this session, with the 7-day low at $98.51 just beneath it; a daily move that takes out both would put price at the bottom edge of the weekly band shown on the chart.
Also worth noting: open interest rising +2.09% while price sits between $99.11 and $101.85 means the range is being built on added positioning rather than on directional follow-through. Funding at 0.0100% is the standard reference reading, so there is no obvious crowding signal attached to it today. The next indicator marker — whether a further add-on entry, a partial exit, or a state change driven by the 1H close against $106.83 — will print on the 15m chart as it happens.