SOL Chart Note Oct 27: Pullwave 1H Trend Filter Still Down
SOLUSDT.P trades at $100.64 with the Pullwave indicator in a short state and its 1H trend line at $107.40. Levels, indicator state and Solana updates.
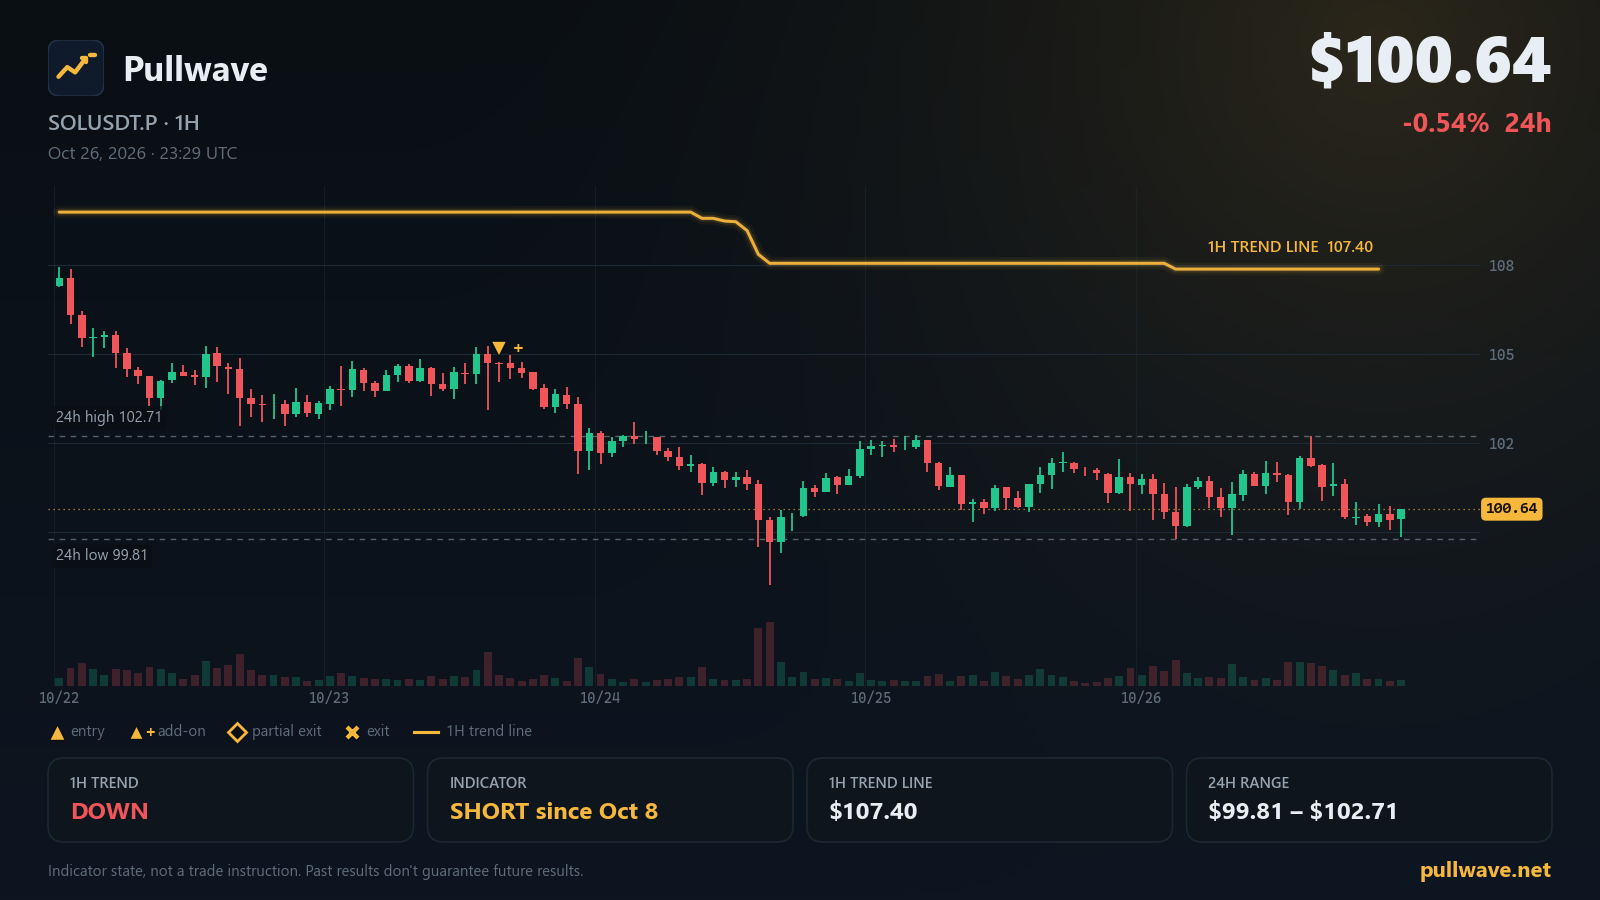
Key levels
- 7-day high109.18
- Indicator 1H trend line107.40A 1H close beyond this line flips the indicator's 1H trend filter.
- 24h high102.71
- 24h low99.81
- 7-day low98.51
- 1H trend
- Down
- Indicator position
- Short since Oct 8
- Last indicator event
- Add-on (short) · 104.34 · Oct 23
- 1H trend line
- 107.40
SOL is starting the day near the lower half of its recent range, with the perpetual futures market quiet rather than dramatic. The Pullwave CYH Pullback Strategy is still reading the higher-timeframe picture as a downtrend, and its trend line sits well above spot. Here is the state of the chart on 2026-10-27 (KST), level by level.
Market snapshot
On SOL USDⓈ-margined perpetual futures (SOLUSDT.P), the last price is $100.64, a 24h change of -0.54%. The 24h range runs from a low of $99.81 to a high of $102.71, which is a narrow band compared with the wider weekly picture: the 7-day high is $109.18 and the 7-day low is $98.51. In other words, price spent the last day coiling inside the bottom third of the weekly range.
Derivatives data is similarly calm. The latest funding rate is 0.0100%, and open interest stands at 8,923,821 SOL, roughly $898M, with a 24h change of +3.45%. Open interest building while price barely moves usually just means new positions are being opened on both sides of a tight range — it does not, by itself, say anything about direction.
What the Pullwave indicator shows
The Pullwave CYH Pullback Strategy runs on SOLUSDT.P using a 1H trend filter together with 15m execution. The trend filter is a volatility-based trailing line drawn on the 1H chart: it follows price at a distance that widens when the market is choppy and tightens when it is calm. Whichever side of that line the 1H candles close on defines the filter's state. Right now the filter is DOWN, and the line itself sits at $107.40. A 1H close above $107.40 would flip the trend filter to UP.
As of this morning the indicator is in a short position state, which it has held since Oct 8, 11:00 UTC (10/8 20:00 KST). Nothing about that state is a recommendation — it is simply what the rule set currently reads on the chart.
The most recent indicator event was an add-on entry on the short side at Oct 23, 15:15 UTC (10/24 00:15 KST), printed near $104.34. An "add-on entry" on this indicator means that, while the trend filter stayed in one direction and price pulled back inside that trend, the execution logic marked a second entry in the same direction as the existing position. A "partial exit" is the mirror idea on the way out: when a move extends, the indicator marks a reduction of the position on the chart rather than closing everything at once. Both are drawn as labels, and the add-on conditions table on the chart shows which conditions are currently satisfied.
All of these signals come from fixed price-and-volume rules — not from a model that learns or guesses. The indicator draws the markers and can fire alerts; the reader decides what, if anything, to do with them.
Key levels on the chart
- $109.18 — 7-day high. The ceiling of the weekly range.
- $107.40 — Indicator 1H trend line. The volatility-based trailing line; a 1H close above it would flip the trend filter to UP.
- $102.71 — 24h high. The top of yesterday's compression.
- $99.81 — 24h low. The bottom of yesterday's compression, just above the weekly floor.
- $98.51 — 7-day low. The lowest print of the past week.
Note how close $99.81 and $98.51 sit relative to the distance up to $107.40: the downside markers are clustered, while the trend line is a long way above the last price of $100.64.
Solana ecosystem and official updates
Network status on status.solana.com currently reads All Systems Operational.
Solana Changelog: October 22, 2026 — 2026-10-23. Solana's weekly changelog reports the Agave v4.3.2 and Firedancer v26.10.4 releases, which include new program SDKs and ongoing work on Alpenglow, validator I/O, gossip, and Transaction V1. Read it on solana.com
Firedancer Mainnet Release v26.10.4 — 2026-10-21. Firedancer v26.10.4 is released as mainnet ready, fixing an issue where the gossip table disagreed with Agave and caused high traffic, and tuning repair algorithm performance for nodes falling behind. Release notes on Firedancer (GitHub)
More Breakpoint 2026 Speakers Confirmed for London — 2026-10-12. Twelve additional speakers have joined the Breakpoint 2026 lineup at Olympia London, running from 15 to 17 November, including leaders from Backpack, Sunrise, Zelle, Bitwise, Y Combinator, Jupiter and Helius. Read it on solana.com
What to watch next
A few conditional observations, framed only around the levels listed above:
- If a 1H candle closes above $107.40, the indicator's trend filter would flip from DOWN to UP, and the short position state shown on the chart would no longer be supported by the higher-timeframe filter.
- As long as 1H closes stay below $107.40, the filter stays DOWN and the 15m execution side keeps looking for pullback setups in that same direction.
- $102.71 is the first marker overhead; price has not traded above it in the last 24 hours, and it sits between the current $100.64 and the trend line at $107.40.
- On the downside, $99.81 and then $98.51 are the nearest reference points. A move through $98.51 would mean a new low for the weekly window.
- $109.18 remains the outer boundary of the 7-day range and is the level above the trend line.
The chart is compressed between $99.81 and $102.71 while the indicator's own reference line sits far above at $107.40 — a configuration worth re-checking after each 1H close.