SOL Chart Note Oct 26: 1H Trend Line Sits at $107.56
SOL trades at $101.10 with the Pullwave 1H trend filter DOWN and its trend line at $107.56. Key levels, indicator state and official Solana updates.
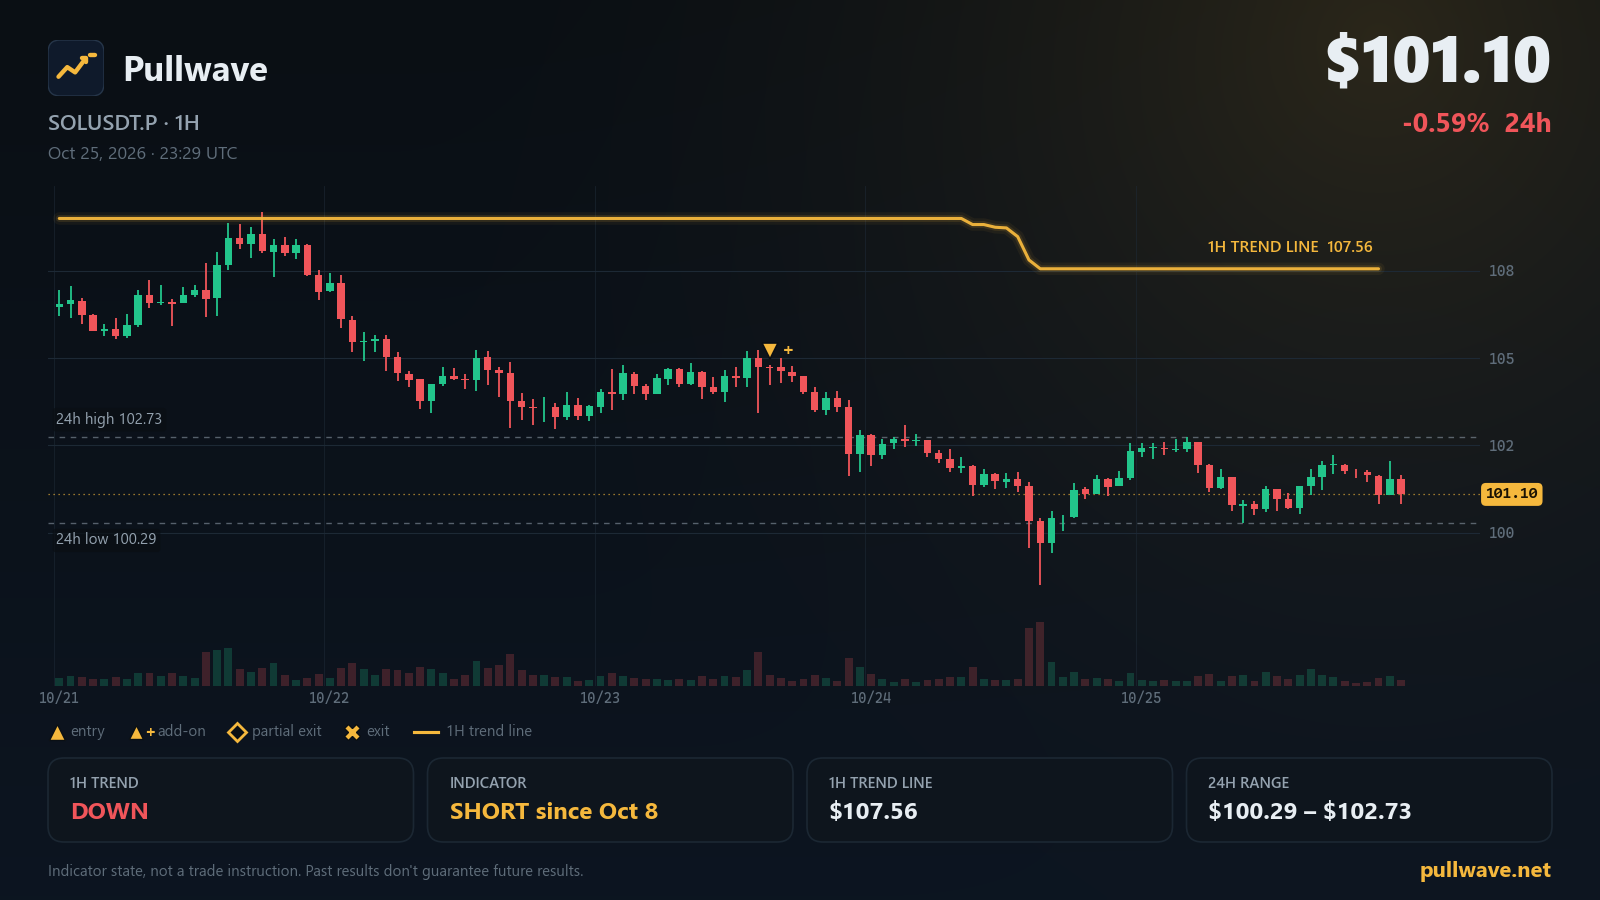
Key levels
- 7-day high109.18
- Indicator 1H trend line107.56A 1H close beyond this line flips the indicator's 1H trend filter.
- 24h high102.73
- 24h low100.29
- 7-day low98.51
- 1H trend
- Down
- Indicator position
- Short since Oct 8
- Last indicator event
- Add-on (short) · 104.34 · Oct 23
- 1H trend line
- 107.56
SOL is starting 2026-10-26 (KST) in the low $101 area after a quiet session, and the Pullwave CYH Pullback Strategy is still showing the same posture it has held for weeks. The 1H trend filter reads DOWN, the indicator is in a short state, and the trend line on the 1H chart sits well above the current price. Below is a plain walkthrough of the chart, the levels the indicator draws attention to, and the official Solana updates on the calendar.
Market snapshot
On SOL USDⓈ-margined perpetual futures (SOLUSDT.P), the last price is $101.10, a 24h change of -0.59%. The 24h range runs from a low of $100.29 to a high of $102.73, so the last day has been a narrow, low-energy session compared with the wider weekly picture. On the 7-day view, price has travelled between a low of $98.51 and a high of $109.18.
Positioning data is similarly subdued. The latest funding rate is 0.0091%, and open interest stands at 8,569,388 SOL (about $867M), a change of -0.36% over 24 hours. Flat funding and a slightly lower open interest describe a market where neither side has been forced to do much, and where the daily range is sitting inside the weekly one rather than testing its edges.
What the Pullwave indicator shows
The Pullwave CYH Pullback Strategy plots its signals from fixed price-and-volume rules — there is no machine learning or prediction layer in it, and the trader places every order manually. The structure has two parts.
The first part is the 1H trend filter. This is a volatility-based trailing line drawn on the 1-hour chart. When price is holding above that line the filter reads UP; when price is holding below it the filter reads DOWN. Because the line trails price at a distance set by recent volatility, it moves gradually rather than flipping on every candle, which is what keeps the filter from reacting to small intraday noise. Right now the filter reads DOWN, and the trend line sits at $107.56. A 1H candle closing above that line would flip the trend filter to UP.
The second part is 15m execution. Inside whatever direction the 1H filter allows, the indicator looks for pullbacks on the 15-minute chart — a counter-move against the prevailing trend — and marks entries there. If a further qualifying pullback appears while the position is already open, the indicator can mark an add-on entry: an additional entry in the same direction, plotted on the chart and listed in the add-on conditions table. When a move extends, the indicator marks partial exits, meaning it flags closing part of the position rather than all of it, leaving the remainder to follow the trend.
As of this morning the indicator has been in a short state since Oct 8, 11:00 UTC (10/8 20:00 KST). The most recent event it printed was an add-on entry (short) at Oct 23, 15:15 UTC (10/24 00:15 KST), near $104.34. Since then the chart has not produced a new marker, so the state is unchanged going into today.
Showing the indicator works on TradingView's free plan; creating alerts from it requires a paid TradingView plan (Essential or higher). Access is granted on a TradingView username by the operator, usually within one business day.
Key levels on the chart
- $109.18 — 7-day high
- $107.56 — Indicator 1H trend line
- $102.73 — 24h high
- $100.29 — 24h low
- $98.51 — 7-day low
Solana ecosystem and official updates
Network status on status.solana.com reads All Systems Operational.
Firedancer Mainnet Release v26.10.4 — 2026-10-21. Firedancer mainnet release v26.10.4 fixes a gossip table mismatch with Agave that caused high traffic, and tunes repair algorithm performance for nodes that are falling behind. Details are in the release notes on Firedancer (GitHub).
More Breakpoint 2026 Speakers Confirmed for London — 2026-10-12. Twelve more speakers, including leaders from Backpack, Sunrise, Zelle, Bitwise, Y Combinator, Jupiter and Helius, join the lineup for Breakpoint 2026 at Olympia London, 15-17 November. The announcement is on solana.com.
What to watch next
A few conditional observations, framed only around the levels listed above:
- If a 1H candle closes above $107.56, the indicator's trend filter would flip from DOWN to UP, which would change which direction its 15m execution is allowed to look for.
- While price stays below $107.56, the filter stays DOWN and the indicator remains in its short state, with any further markers appearing as add-on entries or partial exits rather than a new direction.
- $102.73 is the upper edge of the last 24 hours and $100.29 the lower edge; trade above or below those edges simply tells you the session range has expanded rather than that anything on the indicator has changed.
- $98.51 and $109.18 bracket the last seven days. A move outside that bracket would be the first weekly-range expansion in either direction.
- Funding at 0.0091% and open interest at 8,569,388 SOL are worth rechecking alongside any level break, since a break with no change in positioning reads differently from one with it.
Nothing on the chart is a forecast. The indicator simply describes a state, and that state changes only when the conditions it measures change.