SOL Chart Note — Oct 25: Indicator Short, 1H Line $107.56
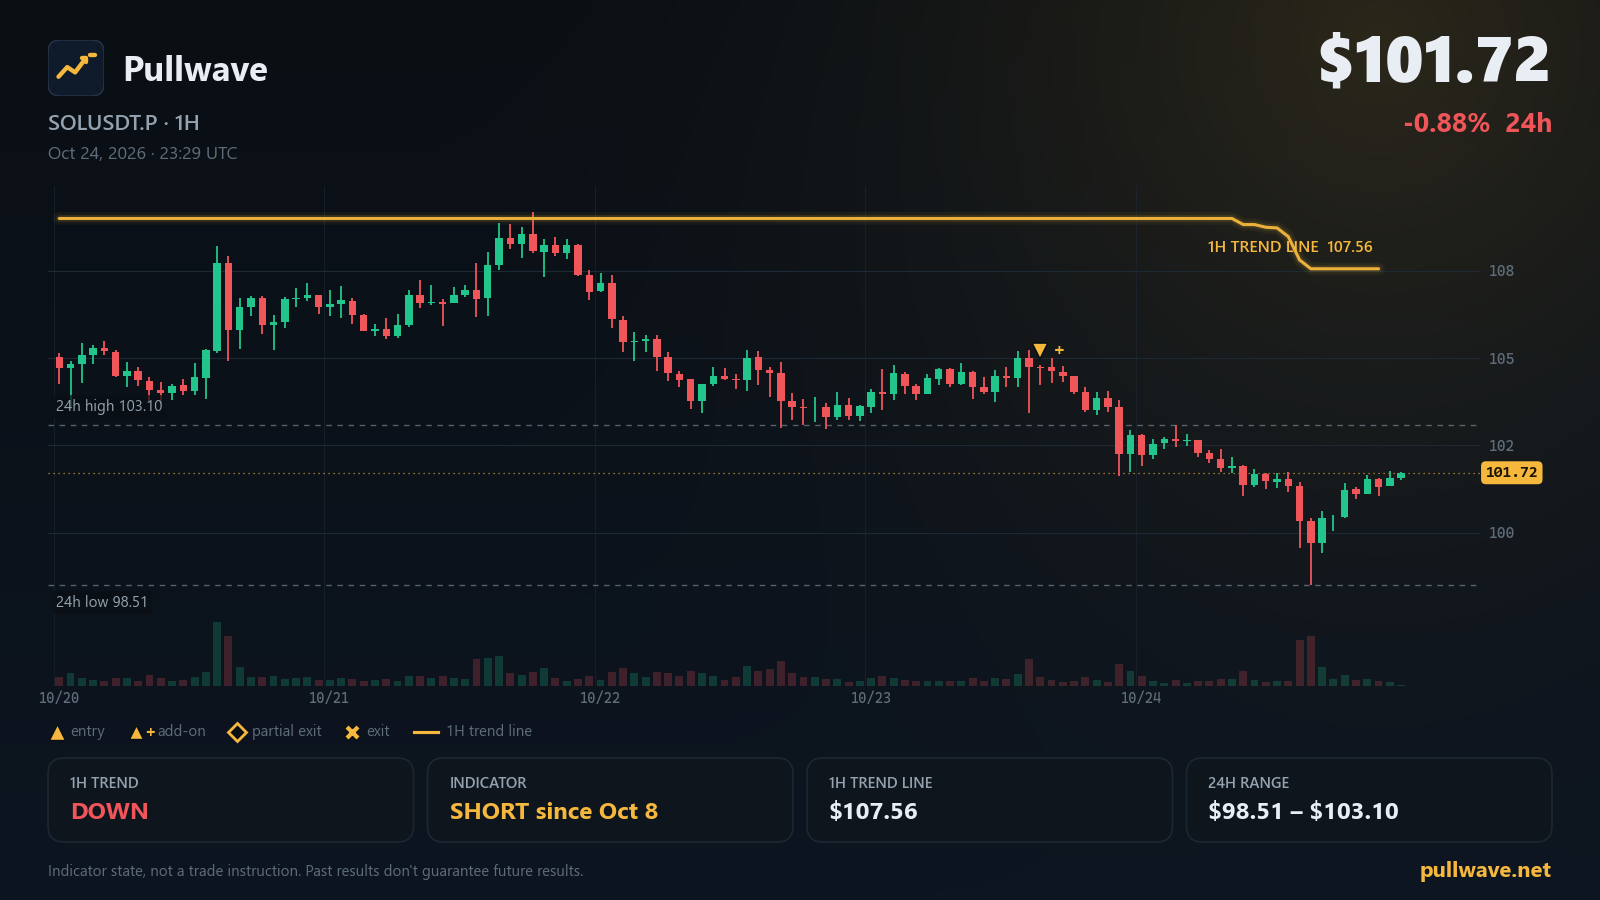
SOL trades at $101.72 with the Pullwave CYH Pullback Strategy in a short state and its 1H trend filter down, trend line at $107.56.
Key levels
- 7-day high109.18
- Indicator 1H trend line107.56A 1H close beyond this line flips the indicator's 1H trend filter.
- 24h high103.10
- 24h low98.51
- 1H trend
- Down
- Indicator position
- Short since Oct 8
- Last indicator event
- Add-on (short) · 104.34 · Oct 23
- 1H trend line
- 107.56
SOL USDⓈ-margined perpetual futures (SOLUSDT.P) open 25 October 2026 (KST) at $101.72, down -0.88% over 24 hours and still sitting in the lower half of the week's range. The Pullwave CYH Pullback Strategy remains in a short state with its 1H trend filter pointing down, and the trend line it draws on the hourly chart sits well above spot at $107.56. Below is a plain reading of where price is, what the indicator is currently showing, and which levels are worth keeping on the chart.
Market snapshot
The last price is $101.72, a -0.88% change over the past 24 hours. Intraday trade has been contained between a 24h high of $103.10 and a 24h low of $98.51, which is also the 7-day low. The 7-day high is $109.18, so the market has spent the week working down from that area toward the bottom of its range rather than expanding upward.
Positioning data is quiet rather than stretched. The latest funding rate reads 0.0056%, a small positive figure, while open interest stands at 8,623,900 SOL — roughly $877M — after a +2.07% change over 24 hours. In other words, slightly more contracts are open than yesterday while price has drifted lower, with funding only marginally on the long side.
On the network itself, status.solana.com reports All Systems Operational, so nothing in the chain's health page is competing with the price picture today.
What the Pullwave indicator shows
The Pullwave CYH Pullback Strategy is an invite-only TradingView indicator built for SOLUSDT.P on the 30m and 15m charts. Its signals come from fixed price-and-volume rules — it is not AI, and it does not place orders. It draws entries, add-on entries and exits directly on the chart, shows an add-on conditions table, and can fire alerts; the user decides what, if anything, to do with that information.
Two pieces of logic sit behind the markings. The first is the 1H trend filter: a volatility-based trailing line plotted on the hourly chart. When price trades under that line the filter reads DOWN; when an hourly candle closes above it, the filter flips to UP. It is a direction switch, not a target. The second piece is 15m execution, which is where the actual entry markings appear once the higher-timeframe direction is set.
Within an established trend, the strategy also looks for pullbacks — moves back against the prevailing direction — and may mark an add-on entry when its conditions line up. And when a move extends, it marks partial exits, meaning some of the position is shown as closed on the chart while the rest stays open.
As of this morning, the state reads as follows:
- 1H trend filter: DOWN
- Indicator position state: SHORT since Oct 8, 11:00 UTC (10/8 20:00 KST)
- Latest indicator event: an add-on entry (short) marked at Oct 23, 15:15 UTC (10/24 00:15 KST) near $104.34
- 1H trend line: $107.56 — a 1H close above it would flip the trend filter to UP
So the indicator has been carrying a short-side bias since early October, and the most recent marking on the chart was an add-on on the short side a couple of days ago, after price had worked back up toward the $104.34 area.
Key levels on the chart
- $109.18 — 7-day high
- $107.56 — Indicator 1H trend line
- $103.10 — 24h high
- $98.51 — 24h low
Solana ecosystem and official updates
More Breakpoint 2026 Speakers Confirmed for London — 2026-10-12. Twelve more speakers were confirmed for Breakpoint 2026, to be held at Olympia London from 15 to 17 November, including leaders from Backpack, Sunrise, Zelle, Bitwise, Y Combinator, Jupiter and Helius. (solana.com)
Firedancer Mainnet Release v26.10.4 — 2026-10-21. Firedancer released mainnet-ready version v26.10.4, fixing a gossip table disagreement issue with Agave that caused high traffic and busyness, and tuning repair algorithm performance for nodes falling behind. (Firedancer (GitHub))
What to watch next
Everything below is conditional and uses only the levels already listed.
The level that actually changes the indicator's state is $107.56. If a 1H candle closes above the trend line at $107.56, the trend filter would flip from DOWN to UP, and the chart markings would be read from the other side. Until such a close prints, the filter stays DOWN and the indicator remains in its short state.
Nearer to spot, $103.10 is the 24h high. Trade back above it would mean the session range has extended upward, though it would still leave price below both the 1H trend line at $107.56 and the 7-day high at $109.18.
On the downside, $98.51 is doing double duty as both the 24h low and the 7-day low. A move through it would mark a new low for the week; holding above it keeps the market inside the range it has traded all week.
Funding at 0.0056% and open interest at 8,623,900 SOL (+2.07% in 24 hours) are worth re-checking alongside those levels, since they describe how crowded the market is while price works between $98.51 and $103.10.