SOL Chart Note — Oct 23: Trend Filter Still Down at $109.00
SOL trades at $103.31 after a -3.44% day. The Pullwave indicator's 1H trend filter reads DOWN with its trend line at $109.00. Levels and official Solana updates.
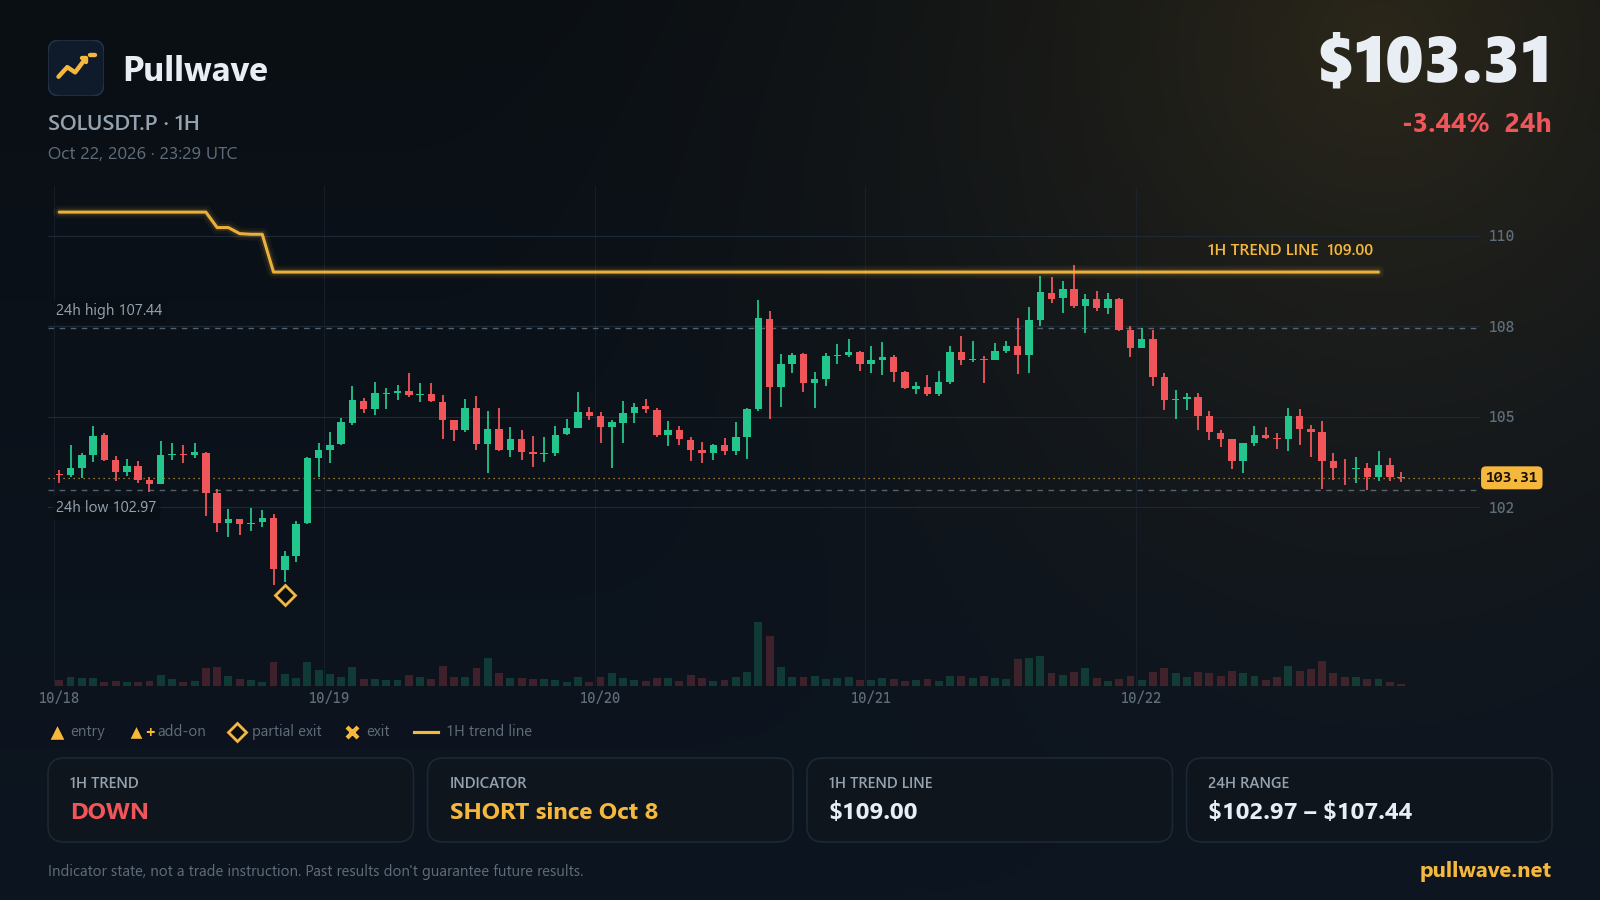
Key levels
- 7-day high109.18
- Indicator 1H trend line109.00A 1H close beyond this line flips the indicator's 1H trend filter.
- 24h high107.44
- 24h low102.97
- 7-day low100.35
- 1H trend
- Down
- Indicator position
- Short since Oct 8
- Last indicator event
- Partial exit (short) · 100.77 · Oct 18
- 1H trend line
- 109.00
Solana's perpetual futures market starts the day on the back foot, with SOLUSDT.P changing hands at $103.31 after a -3.44% move over 24 hours. The Pullwave CYH Pullback Strategy still reads a DOWN trend filter on the 1H chart, and its trend line sits well above price at $109.00. Below is the state of the chart as of this morning (KST, 2026-10-23), plus the official Solana updates worth knowing about.
Market snapshot
SOL USDⓈ-margined perpetual futures (SOLUSDT.P) last printed $103.31, a 24h change of -3.44%. The session range runs from a 24h high of $107.44 down to a 24h low of $102.97, so price is sitting in the lower part of its own daily range rather than near the top of it.
Zooming out to the week, the 7-day high is $109.18 and the 7-day low is $100.35. That frames the recent chart: the week's upper boundary has not been revisited, and price is closer to the lower boundary than the upper one.
Positioning data is quiet rather than dramatic. The latest funding rate is 0.0082%, and open interest stands at 8,497,488 SOL (about $878M), with a 24h change of -0.84%. In other words, slightly less notional exposure is on the table than a day ago, without a violent unwind.
What the Pullwave indicator shows
The Pullwave CYH Pullback Strategy is an invite-only TradingView indicator built for SOLUSDT.P on the 30m and 15m charts. Its signals come from fixed price-and-volume rules — it is not AI, and it does not place orders. It draws long/short entries, add-on entries and exits directly on the chart, shows an add-on conditions table, and can fire alerts; the user places any orders themselves.
The structure has two layers. The first is a 1H trend filter: a volatility-based trailing line plotted on the 1H chart. The line trails price at a distance that widens or narrows with volatility, and whichever side of it the 1H candles close on defines the filter's state. The second layer is 15m execution, which is where the actual entry and exit markers appear. Today the 1H trend filter reads DOWN, and the trend line sits at $109.00. A 1H close above that line would flip the trend filter to UP.
Two more terms show up on the chart. An add-on entry is a marker the indicator prints when price pulls back inside an existing trend and the add-on conditions in the table are met — it is an extension of a position that already exists, not a fresh signal in the other direction. A partial exit is a marker printed when the move extends far enough that the strategy reduces exposure while leaving the rest of the position on the chart.
As of this morning, the indicator has been in a short state since Oct 8, 11:00 UTC. Its most recent event was a partial exit (short) at Oct 18, 20:00 UTC, near $100.77. Nothing new has printed since, so the chart simply shows an ongoing short state under a DOWN trend filter.
Showing the indicator works on TradingView's free plan; creating alerts from it requires a paid TradingView plan (Essential or higher). Access is granted on a TradingView username by the operator, usually within one business day.
Key levels on the chart
- $109.18 — 7-day high
- $109.00 — Indicator 1H trend line
- $107.44 — 24h high
- $102.97 — 24h low
- $100.35 — 7-day low
Solana ecosystem and official updates
Network status on status.solana.com currently reads All Systems Operational.
Firedancer Mainnet Release v26.10.4 — 2026-10-21. Firedancer shipped a mainnet-ready release, v26.10.4, fixing a gossip table disagreement with Agave that caused high traffic and busyness, and tuning repair algorithm performance for nodes falling behind. Details are in the release notes on Firedancer (GitHub).
More Breakpoint 2026 Speakers Confirmed for London — 2026-10-12. Twelve more speakers, including leaders from Backpack, Sunrise, Zelle, Bitwise, Y Combinator, Jupiter and Helius, join Breakpoint 2026 at Olympia London, running 15–17 November. The announcement is on solana.com.
What to watch next
The cleanest thing on the chart is the gap between price and the indicator's own line. If a 1H candle closes above $109.00, the indicator's trend filter would flip to UP; until that happens, the filter stays DOWN regardless of how price moves inside the range. Note how close that line sits to the 7-day high at $109.18 — the two define a single congested zone overhead rather than two separate stories.
Nearer term, $107.44 is the 24h high and marks the top of the current session's range, while $102.97 is the 24h low just under the last price. A session that stays between those two keeps the indicator's state unchanged by definition, since nothing on the 1H filter would be tested.
Below, $100.35 is the 7-day low and the deepest point price has reached this week. It is also the general area where the indicator's last partial exit marker was printed, near $100.77, which makes the zone the most-referenced part of the recent chart. If price revisits it, the thing to observe is simply whether new markers appear on the 15m execution layer, and whether the add-on conditions table changes state — not what any given candle "should" do next.
Funding at 0.0082% and open interest at 8,497,488 SOL (-0.84% over 24h) round out the picture: a drifting market, a DOWN trend filter, and an overhead line at $109.00 that has not been tested.