SOL Chart Note, Oct 22: Pullwave Short, 1H Line at $109.00
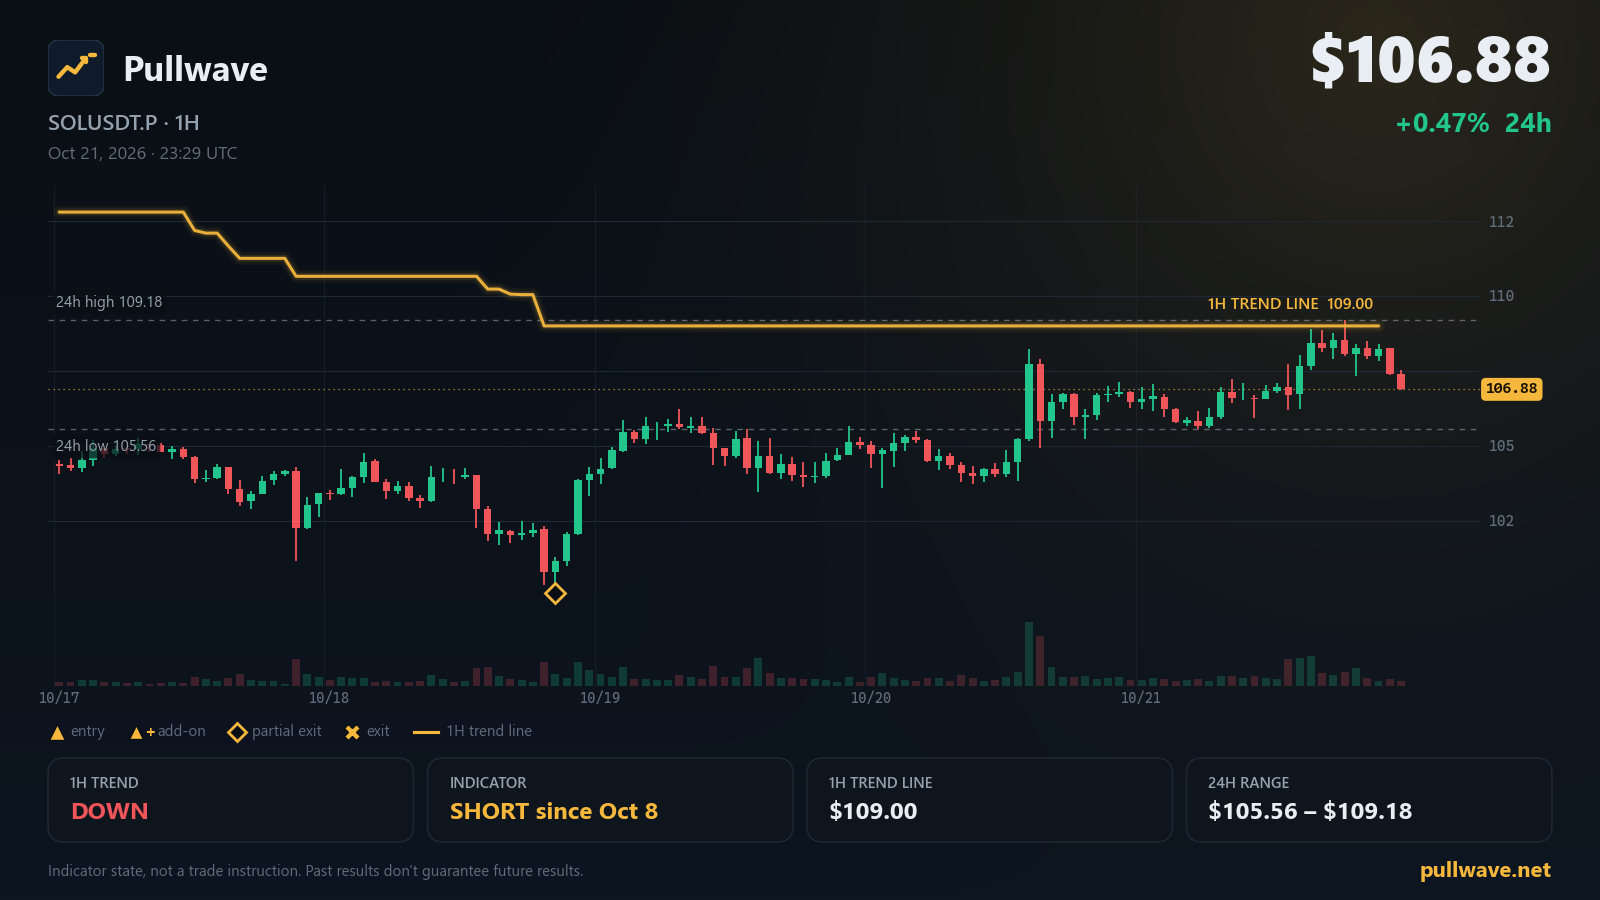
SOLUSDT.P trades at $106.88 with the Pullwave indicator in a short state, its 1H trend filter down and the 1H trend line sitting at $109.00.
Key levels
- 24h high109.18
- Indicator 1H trend line109.00A 1H close beyond this line flips the indicator's 1H trend filter.
- 24h low105.56
- 7-day low100.35
- 1H trend
- Down
- Indicator position
- Short since Oct 8
- Last indicator event
- Partial exit (short) · 100.77 · Oct 18
- 1H trend line
- 109.00
SOL is holding a narrow band this morning, with the perpetual futures market printing a small positive 24h change while the indicator on our chart stays on the short side. The Pullwave CYH Pullback Strategy still reads the 1H trend filter as down, and its trailing trend line sits a little above spot. Here is how the chart looks today, level by level.
Market snapshot
SOL USDⓈ-margined perpetual futures (SOLUSDT.P) last traded at $106.88, a 24h change of +0.47%. The session range runs from a 24h low of $105.56 to a 24h high of $109.18, and that $109.18 print is also the 7-day high, so the last week has not produced a fresh upside extension. On the other side of the week, the 7-day low is $100.35.
Positioning data is quiet rather than stretched. The latest funding rate is 0.0067%, and open interest stands at 8,521,438 SOL, roughly $911M, with a 24h change of -1.21%. In plain terms, a slightly smaller amount of leverage is riding on the pair than a day ago, while price has barely moved.
What the Pullwave indicator shows
The Pullwave CYH Pullback Strategy runs two layers. The first is a 1H trend filter: a volatility-based trailing line drawn on the 1H chart that sits above price in a downtrend and below price in an uptrend. That line is the indicator's definition of direction. Right now it reads DOWN, and the line itself is at $109.00. If a 1H candle closed above $109.00, the indicator's trend filter would flip to UP.
The second layer is 15m execution. Once the filter has picked a direction, the indicator looks for pullbacks inside that trend on the 15m chart and marks entries there. It can also plot an add-on entry: a second marker in the same direction after price pulls back again while the trend filter is unchanged. When a move extends, it plots a partial exit instead — a marker that closes part of the position on the chart while the rest stays open. The indicator draws all of these as labels and can fire alerts; the trader places any orders themselves.
As of this morning the indicator's position state is short, held since Oct 8, 11:00 UTC. Its most recent event was a partial exit on the short side at Oct 18, 20:00 UTC, near $100.77. Since then it has kept the remaining short open, and it reads current 1H structure as a pullback phase inside the downtrend — price working back up toward the trailing line rather than pressing lower.
Key levels on the chart
- $109.18 — 24h high. Also the 7-day high, so it caps both horizons.
- $109.00 — Indicator 1H trend line. A 1H close above it would flip the trend filter to UP.
- $105.56 — 24h low. The lower edge of the current session range.
- $100.35 — 7-day low. The weekly floor, and the area the indicator's last partial exit was taken near.
Note how tightly $109.00 and $109.18 sit together: the indicator's trend line and the recent high are effectively the same zone on the chart, which is why the 1H filter has stayed down through this pullback.
Solana ecosystem and official updates
Network status on status.solana.com reads All Systems Operational.
Firedancer Mainnet Release v26.10.4 — 2026-10-21. Firedancer released mainnet-ready v26.10.4, fixing a gossip table mismatch with Agave that caused high traffic, and tuning repair algorithm performance for nodes falling behind. Source: Firedancer (GitHub).
Release v4.3.2 — 2026-10-15. Anza released Agave v4.3.2, a stable client suitable for Testnet, Devnet and Mainnet Beta, including CI fixes and a ledger-tool update raising the max supported transaction version. Source: Anza Agave (GitHub).
More Breakpoint 2026 Speakers Confirmed for London — 2026-10-12. Twelve more speakers joined the Breakpoint 2026 lineup at Olympia London, 15-17 November, including leaders from Backpack, Sunrise, Zelle, Bitwise, Y Combinator, Jupiter and Helius. Source: solana.com.
What to watch next
Everything below is an observation about the indicator's own mechanics, not a forecast.
- The single level that changes the indicator's reading is $109.00. If a 1H candle closes above it, the trend filter would flip from DOWN to UP, and the indicator's short state would no longer be supported by its own direction layer.
- While 1H closes stay under $109.00, the filter stays down and the indicator continues to treat rallies as pullbacks inside the downtrend. That is the condition under which an add-on marker on the short side can appear on the 15m chart.
- $105.56 marks where the session has been defended so far. Trade below it would put the chart back in the lower part of the weekly range, with $100.35 as the 7-day floor and the area where the last partial exit was marked.
- The mild backdrop supports the quiet price action: funding at 0.0067% and open interest down -1.21% over 24h describe a market shedding a little exposure rather than crowding into one side.
For a reader following the chart, the practical checkpoint today is simply which side of $109.00 the 1H candles close on. Everything in the indicator's current state — the down filter, the short position held since Oct 8, 11:00 UTC, the pullback read — hangs on that one line.