SOL Oct 21: Pullwave 1H Trend Line Sits at $109.00
SOL trades at $106.36 with the Pullwave CYH Pullback Strategy in a short state and its 1H trend line at $109.00. Levels, indicator state and Solana updates.
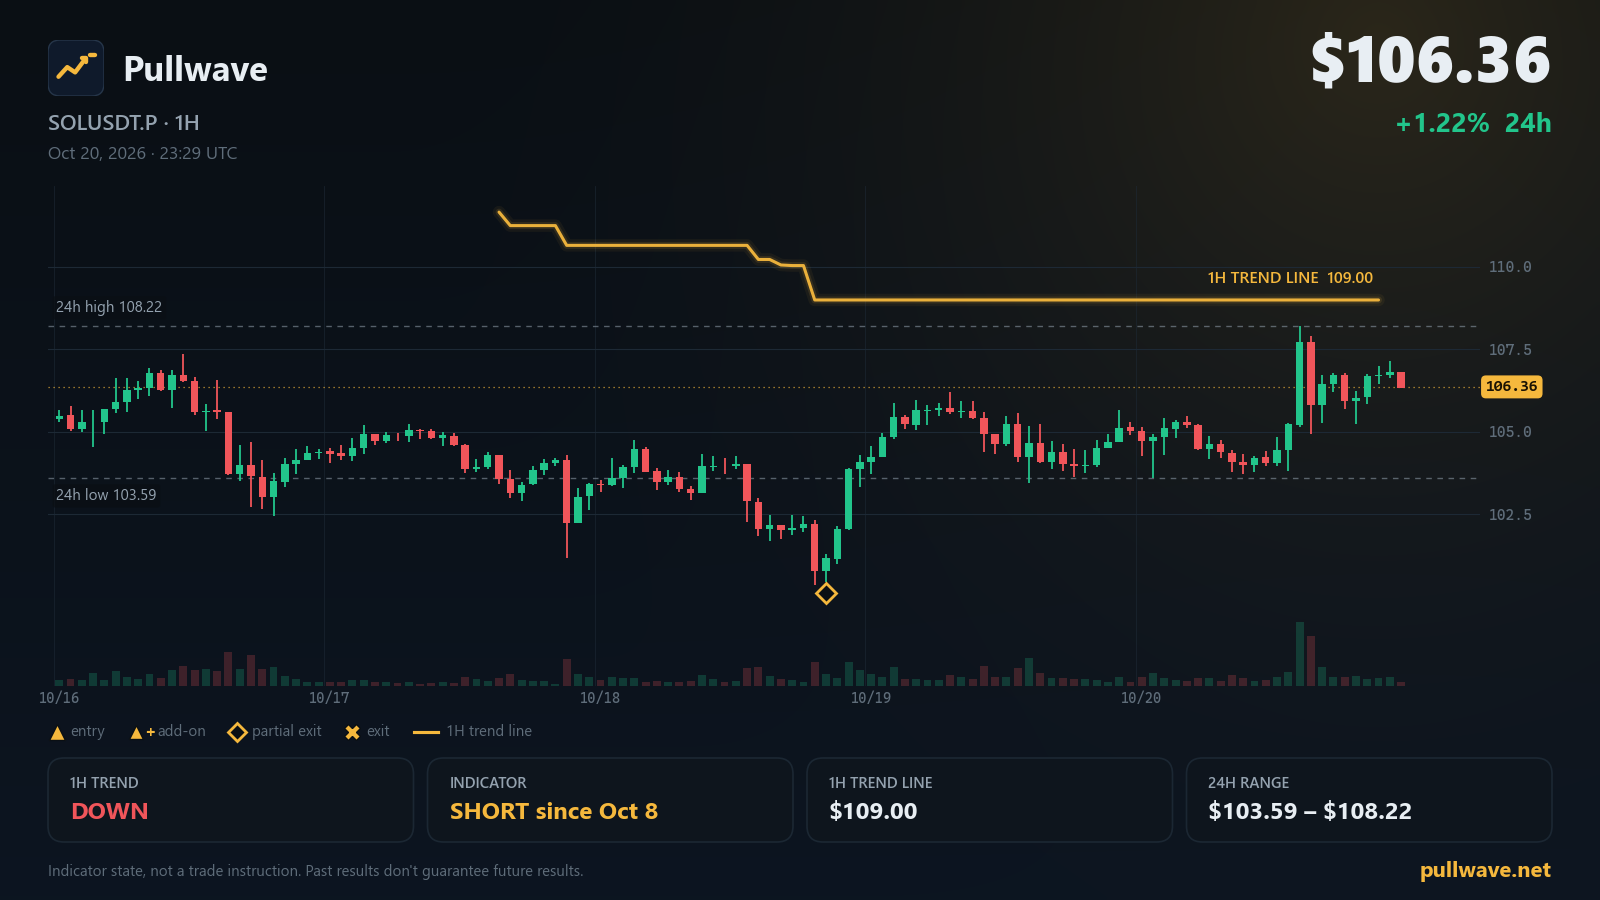
Key levels
- Indicator 1H trend line109.00A 1H close beyond this line flips the indicator's 1H trend filter.
- 7-day high108.65
- 24h high108.22
- 24h low103.59
- 7-day low100.35
- 1H trend
- Down
- Indicator position
- Short since Oct 8
- Last indicator event
- Partial exit (short) · 100.77 · Oct 18
- 1H trend line
- 109.00
SOL perpetual futures spent the last day inside a fairly narrow band, finishing the session higher while the weekly range stayed intact. The Pullwave CYH Pullback Strategy is still reading the higher-timeframe picture as a downtrend, and its trailing 1H trend line is now the single number that separates that reading from a flip. Below is the state of the chart as of this morning (KST), the levels the indicator draws, and the official Solana updates from the past week.
Market snapshot
SOL USDⓈ-margined perpetual futures (SOLUSDT.P) last traded at $106.36, a 24h change of +1.22%. The 24h high came in at $108.22 and the 24h low at $103.59, so the day's action unfolded entirely inside the wider weekly band marked by the 7-day high at $108.65 and the 7-day low at $100.35.
Positioning data is quiet rather than stretched. The latest funding rate is 0.0015%, and open interest stands at 8,637,392 SOL — roughly $919M — after a 24h change of -1.67%. In plain terms, a slightly smaller pile of open contracts and a funding print that close to flat suggests neither side is paying much to hold its exposure right now.
On the network side, status.solana.com reports All Systems Operational, so nothing in the chart has an infrastructure story attached to it today.
What the Pullwave indicator shows
The Pullwave CYH Pullback Strategy runs on SOLUSDT.P using two timeframes. On the 1H chart it maintains a volatility-based trailing line — the trend filter. That line only moves in one direction while a trend holds, and it defines the direction the indicator is willing to work in. Execution then happens on the 15m chart, where the indicator looks for a pullback inside that established trend before it marks an entry. All of this comes from fixed price-and-volume rules; there is no machine learning anywhere in the logic.
Two terms show up repeatedly on the chart. An add-on entry is a second (or later) marker in the same direction, printed after price pulls back inside a trend that is already in force — the add-on conditions table on the chart tracks whether those conditions are met. A partial exit is a marker that closes part of the existing position when the move has extended, leaving the rest of it open. The indicator draws these markers and can fire alerts; the user is the one who places any orders.
Current state:
- 1H trend filter: DOWN
- Indicator position state: SHORT since Oct 8, 11:00 UTC (10/8 20:00 KST)
- Latest indicator event: a partial exit on the short at Oct 18, 20:00 UTC (10/19 05:00 KST), near $100.77
- 1H trend line: $109.00 — a 1H close above this line would flip the trend filter to UP
So the indicator has been in a short state since early October, took a partial exit near $100.77 three days ago, and is still carrying the remainder with the filter pointed down.
Key levels on the chart
- $109.00 — Indicator 1H trend line
- $108.65 — 7-day high
- $108.22 — 24h high
- $103.59 — 24h low
- $100.35 — 7-day low
Solana ecosystem and official updates
Firedancer Mainnet Release v26.10.3 — 2026-10-20. Firedancer released mainnet-ready version v26.10.3, improving repair performance through better peer selection and timeouts, and enhancing the performance and reliability of its Alpenglow consensus implementation. Source: Firedancer (GitHub).
Release v4.3.2 — 2026-10-15. Anza released Agave v4.3.2, a stable client update suitable for Testnet, Devnet and Mainnet Beta, including CI fixes and a bumped max supported transaction version in ledger-tool. Source: Anza Agave (GitHub).
Geo-Aware Leader Schedule — 2026-10-14. Solana published a study on SIMD-0675, a geo-aware leader schedule that reorders leaders by location to cut handoff latency, without changing any validator's number of leader windows. Source: solana.com.
More Breakpoint 2026 Speakers Confirmed for London — 2026-10-12. Twelve more speakers, including leaders from Backpack, Bitwise, Zelle and Jupiter, joined the Breakpoint 2026 lineup at Olympia London, running 15-17 November. Source: solana.com.
What to watch next
A few conditional observations, using only the levels already on the chart:
- If a 1H candle closes above $109.00, the indicator's trend filter would flip from DOWN to UP, which changes the direction the 15m execution layer is allowed to work in.
- As long as 1H closes stay below $109.00, the filter remains DOWN and the indicator stays in its current short state.
- The cluster between $108.22 (24h high) and $108.65 (7-day high) sits just under the trend line, so any approach to $109.00 would have to pass through both of those marks first.
- On the downside, $103.59 is the 24h low and $100.35 the 7-day low. Price trading back toward $100.35 would return the chart to the area where the last partial exit printed near $100.77.
- Funding at 0.0015% and open interest down -1.67% over 24h are worth re-checking alongside any move through those levels, since they describe how crowded the move is rather than its direction.
Nothing here is a forecast — it is a description of where the indicator's lines currently sit and what a close on either side of them would mean for its state.