SOL Chart Note, Oct 17: Pullback Inside a 1H Downtrend
SOLUSDT.P trades at $104.28 with the Pullwave CYH Pullback Strategy in a short state and its 1H trend filter pointing DOWN at $112.80.
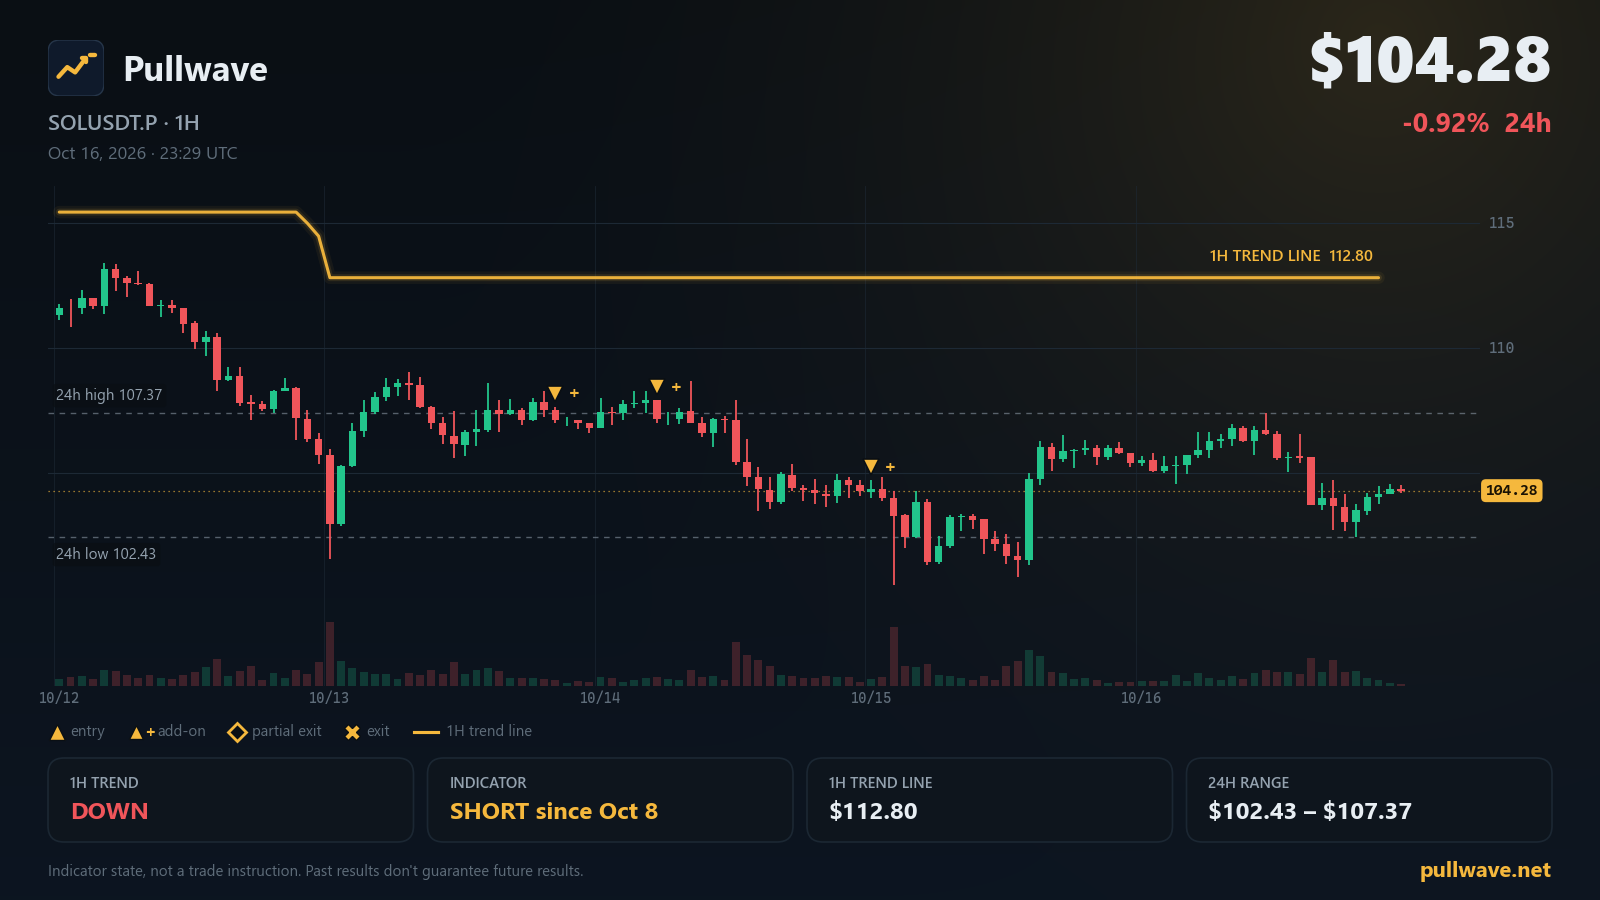
Key levels
- 7-day high113.38
- Indicator 1H trend line112.80A 1H close beyond this line flips the indicator's 1H trend filter.
- 24h high107.37
- 24h low102.43
- 7-day low100.51
- 1H trend
- Down
- Indicator position
- Short since Oct 8
- Last indicator event
- Add-on (short) · 104.24 · Oct 15
- 1H trend line
- 112.80
SOL is spending another session in the middle of its weekly range, and the Pullwave CYH Pullback Strategy has not changed its reading. The 1H trend filter still points DOWN, and the indicator has been in a short state since Oct 8. Below is the state of the chart as of this morning, plus the official Solana updates that landed this week.
Market snapshot
SOL USDⓈ-margined perpetual futures (SOLUSDT.P) last traded at $104.28, a 24h change of -0.92%. The day's range runs from a 24h low of $102.43 to a 24h high of $107.37, which keeps price inside the wider weekly band marked by the 7-day high at $113.38 and the 7-day low at $100.51.
Positioning data is quiet rather than stretched. The latest funding rate is -0.00006%, effectively flat, so neither side is paying a meaningful premium to hold exposure. Open interest sits at 8,938,583 SOL, roughly $932M, up +1.29% over 24 hours — a small build rather than a sharp expansion. Taken together, a mid-range price, flat funding and a modest open interest increase describe a market that is consolidating rather than trending hard in either direction.
What the Pullwave indicator shows
The Pullwave CYH Pullback Strategy runs on SOLUSDT.P using 30m and 15m charts, and its signals come from fixed price-and-volume rules — not from any learning model.
Two pieces work together. The first is the 1H trend filter, a volatility-based trailing line plotted on the 1H chart. The line trails price at a distance that widens when the market is choppy and tightens when it is calm, and whichever side of the line the 1H closes land on defines the filter's direction. Right now that direction is DOWN, and the line sits at $112.80. A 1H close above $112.80 would flip the trend filter to UP; until that happens, the filter stays on the down side.
The second piece is 15m execution. Inside an established trend, the indicator waits for price to pull back against the direction of the move, then looks for its rule set to line up again on the lower timeframe. That is the phase the chart is in now: the 1H structure reads as a pullback inside the downtrend.
The indicator's current position state is SHORT, held since Oct 8, 11:00 UTC. Its most recent event was an add-on entry on the short side at Oct 15, 00:00 UTC, near $104.24. An add-on entry means the indicator's add-on conditions table was satisfied after a pullback, so it marked a second stacked entry in the same direction as the existing position rather than opening a new, independent trade. Its counterpart is the partial exit: when a move extends in the indicator's favour, it marks a reduction of part of the position on the chart instead of closing everything at once, leaving the remainder to track the trend. All of these are drawings and optional alerts on the chart — the trader places any orders themselves.
Key levels on the chart
- $113.38 — 7-day high
- $112.80 — Indicator 1H trend line
- $107.37 — 24h high
- $102.43 — 24h low
- $100.51 — 7-day low
Solana ecosystem and official updates
Network status at status.solana.com reads All Systems Operational.
Geo-Aware Leader Schedule — 2026-10-14. An analysis of SIMD-0675, a geo-aware leader schedule for Solana, shows it reorders consecutive leaders by location to cut handoff latency without changing each validator's number of leader windows. It recommends STAKE_FLOOR near 10% and RUN_LENGTH between 3 and 7. (solana.com)
Firedancer Mainnet Release v26.10.2 — 2026-10-14. Firedancer released mainnet-ready v26.10.2, adding Alpenglow support (enabled by default on testnet/devnet) and support for all Solana 4.3 features. The release reduced mainnet memory usage from 183 to 159 GiB and brought snapshot loading down to 40 seconds. (Firedancer (GitHub))
Release v4.3.2 — 2026-10-15. Anza released Agave v4.3.2, a stable client release suitable for Testnet, Devnet and Mainnet Beta. It includes CI fixes, a ledger-tool transaction version bump, and other backported changes. (Anza Agave (GitHub))
More Breakpoint 2026 Speakers Confirmed for London — 2026-10-12. Twelve more speakers joined the Breakpoint 2026 lineup at Olympia London, held 15-17 November, including leaders from Backpack, Sunrise, Zelle, Bitwise, Y Combinator, Jupiter and Helius. (solana.com)
What to watch next
A few conditional observations, using only the levels already on the chart:
- If a 1H candle closes above $112.80, the indicator's trend filter would flip from DOWN to UP, which would change the side the 15m execution logic is allowed to work on.
- As long as 1H closes stay below $112.80, the filter stays DOWN and the chart remains in the pullback phase it is in now.
- $107.37, the 24h high, is the nearest marker above the current price; a push through it would leave the gap up to $112.80 and then $113.38 as the next reference points on the chart.
- On the other side, $102.43 is the 24h low and $100.51 the 7-day low. Trade through $102.43 would put the weekly floor at $100.51 back in view as the lower edge of the range.
- Funding at -0.00006% and open interest at 8,938,583 SOL are worth re-checking alongside price; a flat funding rate tells you little on its own, but a change in it while price tests either edge of the range is more informative than either number in isolation.
Nothing in the indicator's state changed overnight: still a short state since Oct 8, still a DOWN 1H filter, with the most recent event being the Oct 15 add-on entry near $104.24.