SOL Chart Note — Oct 16: Pullwave Short, 1H Trend Down
SOL trades at $105.29 with the Pullwave CYH Pullback Strategy in a short state and the 1H trend line at $112.80. Levels, indicator state and Solana updates.
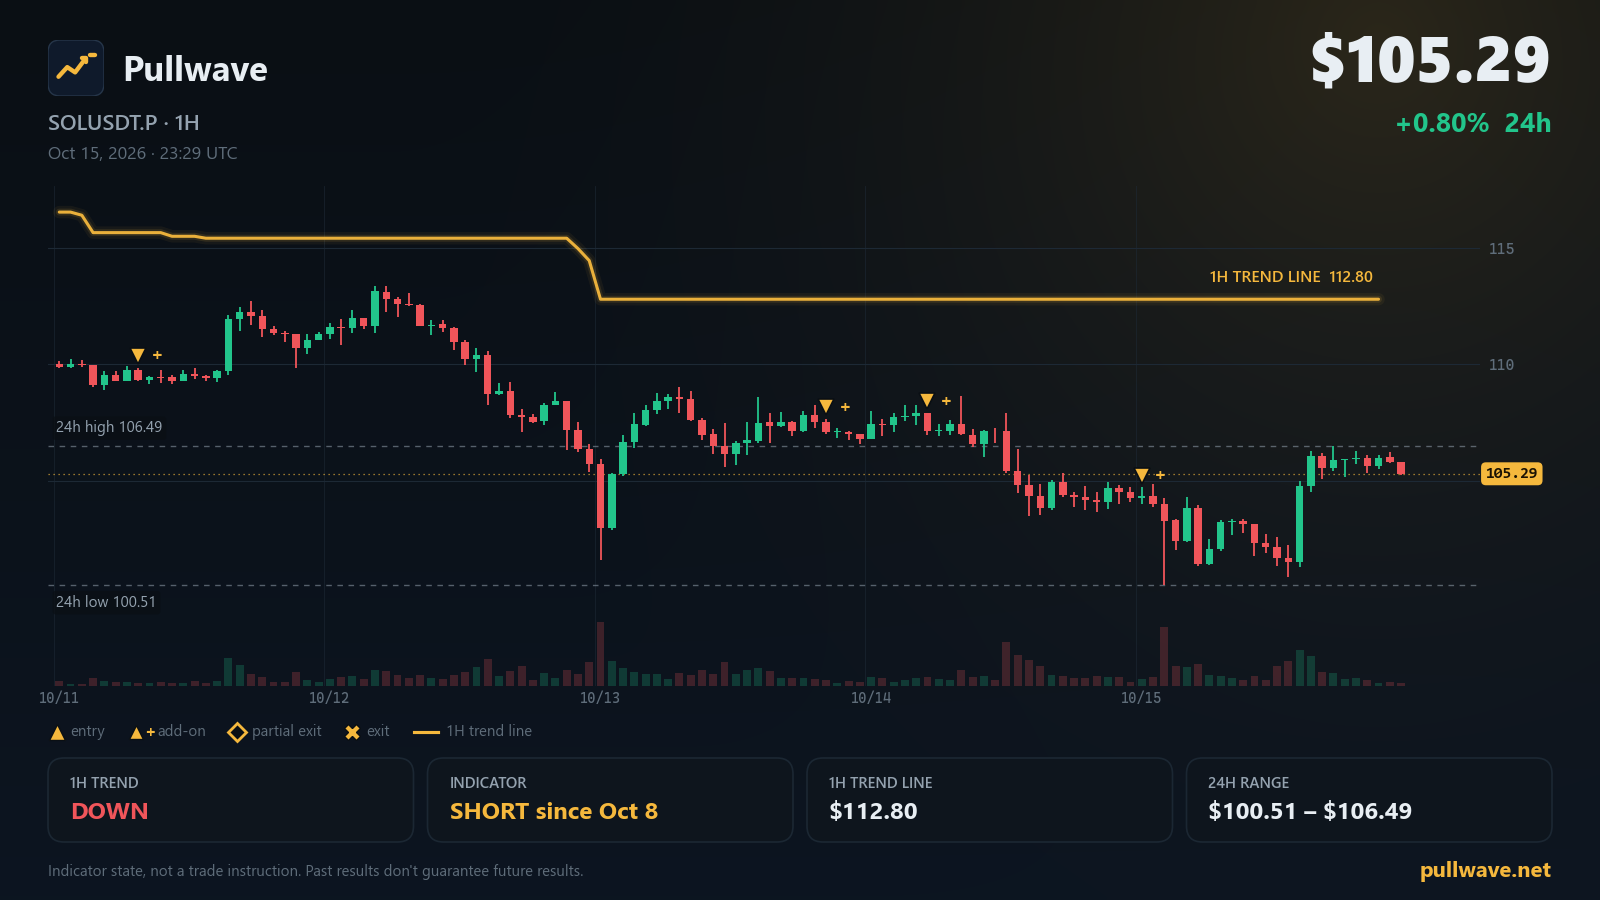
Key levels
- 7-day high113.38
- Indicator 1H trend line112.80A 1H close beyond this line flips the indicator's 1H trend filter.
- 24h high106.49
- 24h low100.51
- 1H trend
- Down
- Indicator position
- Short since Oct 8
- Last indicator event
- Add-on (short) · 104.24 · Oct 15
- 1H trend line
- 112.80
SOL is holding a narrow band near the lower part of its weekly range, with the last price at $105.29 and a 24h change of +0.80%. The Pullwave CYH Pullback Strategy is still in a short state on SOLUSDT.P, and its 1H trend filter continues to read DOWN. Below is today's read of the chart: where price sits, what the indicator is showing, the levels it is built around, and the official Solana updates from the past few days.
Market snapshot
SOL USDⓈ-margined perpetual futures (SOLUSDT.P) last traded at $105.29, up +0.80% over 24 hours. The 24h high was $106.49 and the 24h low was $100.51, so the session has been a fairly tight one compared with the week. On the weekly view, the 7-day high is $113.38 and the 7-day low is $100.51 — and because yesterday's low and the weekly low are the same number, the bottom of the 7-day range is also the most recent defended area on the chart.
Derivatives data is calm rather than stretched. The latest funding rate is 0.0048%, and open interest stands at 8,821,587 SOL (about $929M), a change of +1.41% over 24 hours. Open interest edging up while price holds in the lower half of the weekly range simply means positioning is being added around the current area rather than unwinding.
What the Pullwave indicator shows
The Pullwave CYH Pullback Strategy is an invite-only TradingView indicator for SOLUSDT.P, used on the 30m and 15m charts. Its signals come from fixed price-and-volume rules — it is not AI, and there is no machine learning layer deciding anything. The indicator draws long and short entries, add-on entries and exits directly on the chart, keeps an add-on conditions table on screen, and can send alerts. Any order placement is done by the user.
The logic has two layers. The first is a 1H trend filter: a volatility-based trailing line plotted from 1H data. That line sits above price in a downtrend and below price in an uptrend, and it only changes side when a 1H candle closes through it. Right now the 1H trend filter reads DOWN, and the 1H trend line sits at $112.80. A 1H close above that line would flip the trend filter to UP.
The second layer is 15m execution. Inside whichever direction the 1H filter allows, the indicator waits for a pullback — a counter-move against the trend — and uses the 15m chart to time its entry when that pullback shows signs of ending. If the move then continues in the trend direction after a further pullback, the indicator may mark an add-on entry, which is a second (or later) entry stacked on the same open position rather than a brand-new trade. When the move extends in favour of the position, it marks partial exits: it closes part of the position and leaves the rest running, instead of flattening everything at once.
As of this morning, the indicator's position state is SHORT, held since Oct 8, 11:00 UTC. Its most recent event was an add-on entry (short) at Oct 15, 00:00 UTC, printed near $104.24. The 1H structure is currently labelled a pullback phase inside the downtrend — in other words, price is recovering upward while the 1H filter still reads DOWN.
Showing the indicator on a chart works on TradingView's free plan; creating alerts from it requires a paid TradingView plan (Essential or higher). Access is granted on a TradingView username by the operator, usually within one business day. Every backtest and every trade is published on the site, and futures backtests include fees, funding and slippage.
Key levels on the chart
- $113.38 — 7-day high
- $112.80 — Indicator 1H trend line
- $106.49 — 24h high
- $100.51 — 24h low
Solana ecosystem and official updates
Network status at status.solana.com currently reads All Systems Operational.
Firedancer Mainnet Release v26.10.2 — 2026-10-14. Firedancer released mainnet-ready version v26.10.2, adding Alpenglow support (default on testnet/devnet), support for all Solana 4.3 features, and reducing mainnet memory usage from 183 to 159 GiB. Details are in the release notes on Firedancer (GitHub).
Geo-Aware Leader Schedule — 2026-10-14. A study evaluates SIMD-0675, a geo-aware leader schedule that reorders validator turns by location to cut handoff latency without changing each validator's number of leader windows. It recommends STAKE_FLOOR around 10% and RUN_LENGTH between 3 and 7, per the write-up on solana.com.
More Breakpoint 2026 Speakers Confirmed for London — 2026-10-12. Twelve more speakers, including leaders from Backpack, Sunrise, Zelle, Bitwise, Y Combinator, Jupiter and Helius, join the Breakpoint 2026 lineup at Olympia London, running 15-17 November. The updated lineup is posted on solana.com.
What to watch next
The single mechanical condition on the chart is the 1H trend line at $112.80. While 1H candles keep closing below it, the indicator's trend filter stays DOWN and only short-side setups are permitted by the first layer. If a 1H candle closes above $112.80, the trend filter would flip to UP, and the indicator would stop looking for short-side pullback entries.
Between here and there sit $106.49, the 24h high, and $113.38, the 7-day high. A move back under $100.51, the 24h low — which is also the 7-day low — would put price below the whole week's range, while trade between $100.51 and $106.49 keeps the current pullback phase description intact. Because the indicator is already in a short state with an add-on entry marked near $104.24, any further event it prints would most likely be either another add-on entry or a partial exit, depending on which direction the 15m execution layer resolves.