SOL Oct 9: Pullwave Indicator Holds Short Under $116.63
SOL slips to $110.33 as Pullwave's 1H trend filter stays down and its short state continues from Oct 8.
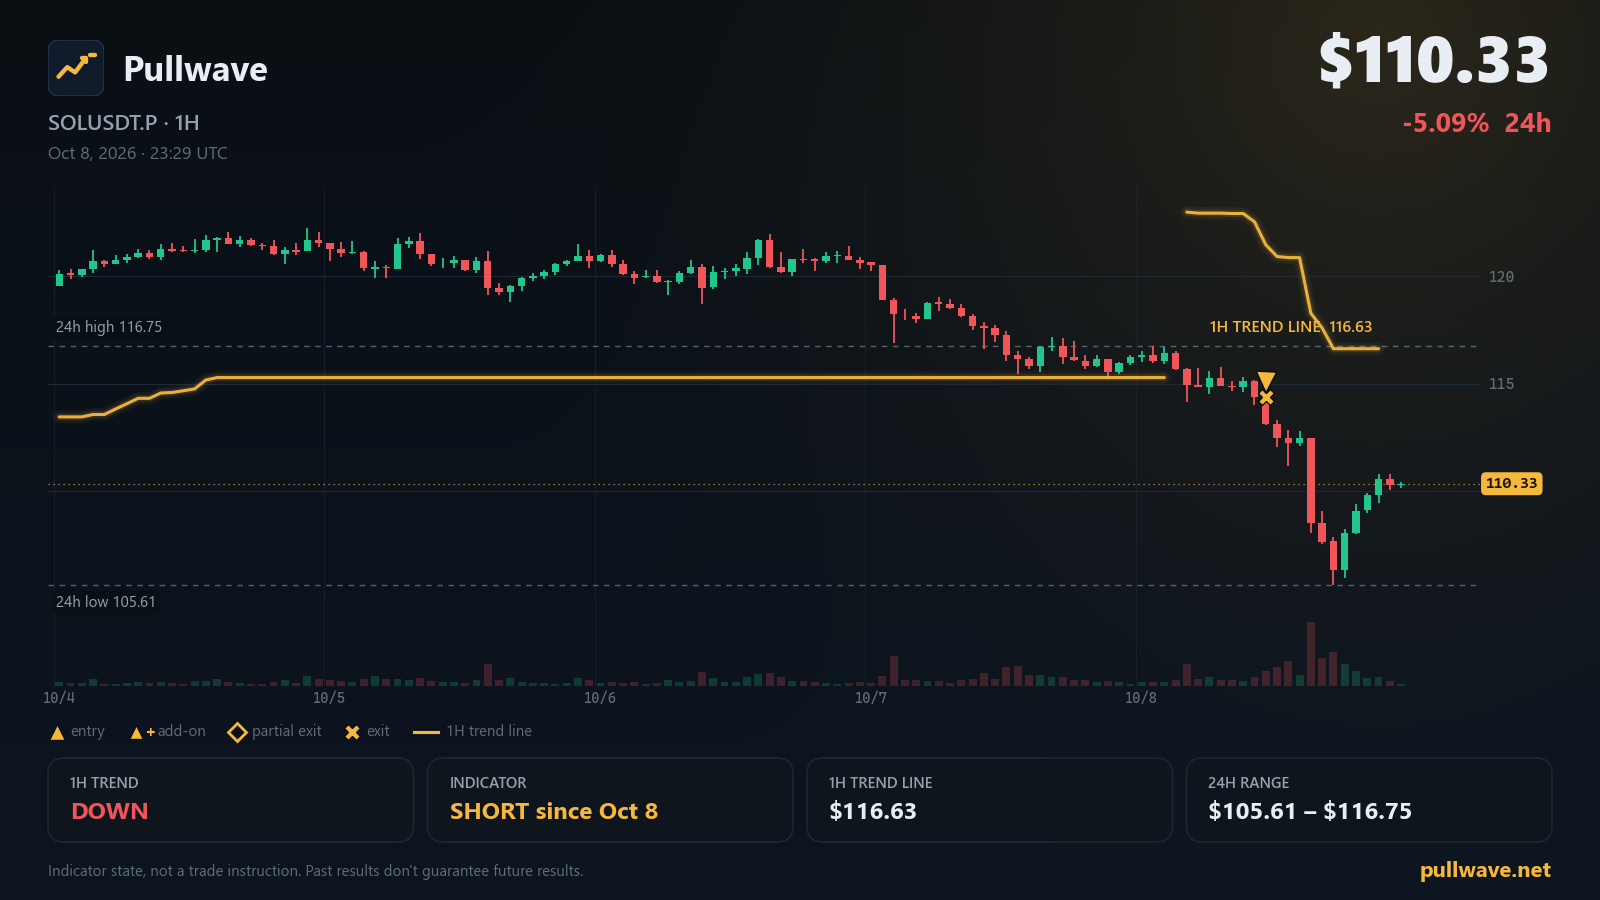
Key levels
- 7-day high123.77
- 24h high116.75
- Indicator 1H trend line116.63A 1H close beyond this line flips the indicator's 1H trend filter.
- 24h low105.61
- 1H trend
- Down
- Indicator position
- Short since Oct 8
- Last indicator event
- Entry (short) · 114.36 · Oct 8
- 1H trend line
- 116.63
SOL pulled back sharply over the past day, and the Pullwave CYH Pullback Strategy indicator remains positioned on the short side of that move. Here's what the chart, the indicator's current state, and the latest official Solana updates show this morning.
Market snapshot
SOLUSDT.P last traded at $110.33, down 5.09% over the past 24 hours. The 24-hour range spans from $105.61 to $116.75, while the 7-day range runs from $105.61 up to $123.77. Funding on the perpetual sits at -0.0156%, and open interest is 8,630,643 SOL (about $952M), up 0.57% over the past 24 hours.
What the Pullwave indicator shows
The Pullwave CYH Pullback Strategy runs its logic from a 1H trend filter combined with 15m execution. The 1H trend filter is a volatility-based trailing line plotted on the 1-hour chart; price staying below it keeps the filter reading down, while a 1H candle closing back above it would flip the filter to up. As of this morning, that filter reads down, and the trend line itself sits at $116.63.
The indicator's position state is short, opened at the entry (short) event on Oct 8, 11:00 UTC near $114.36. On this indicator, an add-on entry refers to a second entry added to an existing position after price pulls back inside the prevailing trend direction on the 15m chart, while a partial exit means the indicator closes a portion of the position once the move has extended far enough to meet its internal exit rules. No add-on or exit event has fired since the Oct 8, 11:00 UTC short entry, so the indicator remains in its original short state with the 1H trend filter still down.
It's worth repeating what this tool is and isn't: it is not an AI system. It runs on fixed price-and-volume rules, plots entries, add-ons and exits directly on the chart, and can send alerts — but every order is still placed by the person watching the chart, not by the indicator itself.
Key levels on the chart
- $123.77 — 7-day high
- $116.75 — 24h high
- $116.63 — Indicator 1H trend line
- $105.61 — 24h low
Solana ecosystem and official updates
Firedancer Mainnet Release v26.09.6 (2026-10-06): Firedancer v26.09.6 is a mainnet-ready release that improves validator behavior during degraded network conditions, reduces validator stalls, and fixes rare identity switch bugs. Source: Firedancer (GitHub)
Solana Foundation Launches Solana DvP, an Atomic Settlement Program Built for Financial Institutions (2026-10-06): Solana Foundation launched Solana DvP, an open-source, MIT-licensed atomic settlement program for financial institutions, developed with input from J.P. Morgan, offering escrow-based delivery-versus-payment settlement with finality in seconds rather than days. Source: solana.com
Breakpoint 2026: A guide to getting oriented (Part 1) (2026-09-18): Breakpoint 2026, Solana's flagship annual conference, will take place in London on November 15-17 at Olympia Convention Centre, gathering over 7,000 people from 100+ countries. Source: solana.com
Separately, status.solana.com currently reports all systems operational.
What to watch next
If a 1H candle closes above the indicator's 1H trend line at $116.63, the trend filter would flip from down to up, which is the condition the indicator watches for a potential shift away from the current short state. Price action around the 24h high at $116.75 and the 7-day high at $123.77 would need to be cleared on the way to any such flip, given where the trend line currently sits relative to those levels. On the downside, the 24h low at $105.61 remains the lower boundary of the past day's range; a move through that level without first reclaiming $116.63 would keep price action below the trend line and the indicator's short state intact. Watching how price interacts with $116.63 relative to the $116.75 and $105.61 range bounds is the simplest way to track whether the indicator's 1H trend filter stays down or shifts in either direction from here.