SOL Chart Note: Oct 8 Pullback Inside an Uptrend
SOL holds above $115.21 as Pullwave's 1H trend filter stays up and the indicator remains in a long state.
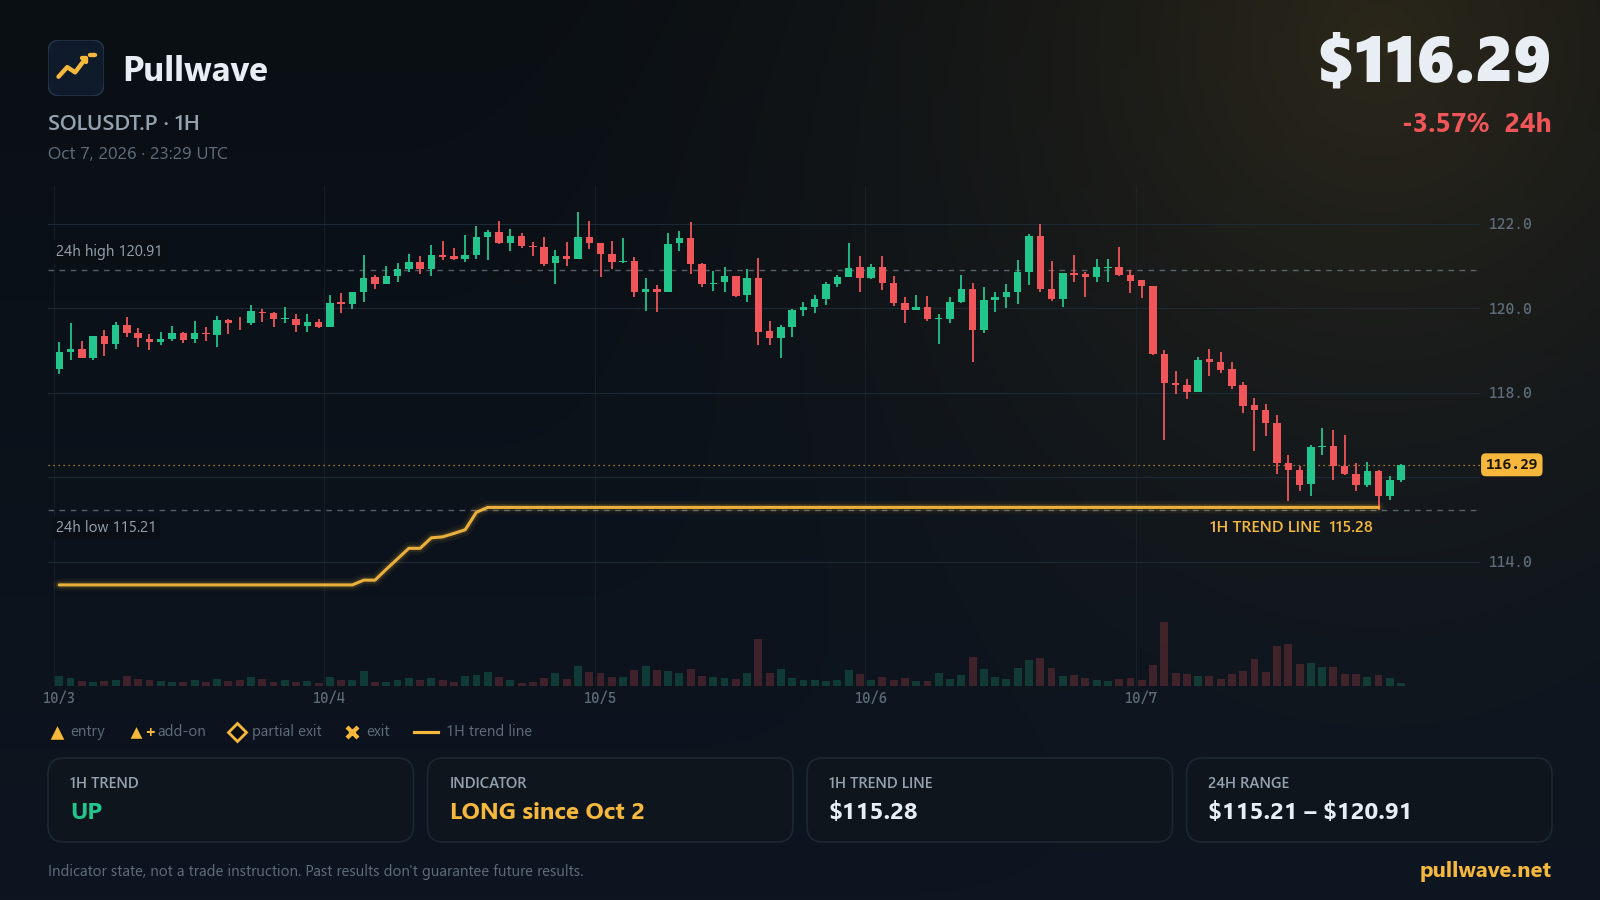
Key levels
- 7-day high123.77
- 24h high120.91
- Indicator 1H trend line115.28A 1H close beyond this line flips the indicator's 1H trend filter.
- 24h low115.21
- 1H trend
- Up
- Indicator position
- Long since Oct 2
- Last indicator event
- Entry (long) · 118.85 · Oct 2
- 1H trend line
- 115.28
SOL is trading inside a quieter range this morning after yesterday's pullback. The Pullwave CYH Pullback Strategy indicator is still reading the move as a pullback within a larger uptrend rather than a reversal. Here is what the chart and the indicator show as of today, Oct 8.
Market snapshot
SOL USDⓈ-margined perpetual futures (SOLUSDT.P) last traded at $116.29, down 3.57% on the 24h period. The 24h range spans from a low of $115.21 to a high of $120.91, while the 7-day range runs from $115.21 up to $123.77. Funding sits near zero at -0.00038%, and open interest is 8,576,846 SOL (about $997M), up 3.10% over the last 24 hours.
What the Pullwave indicator shows
Pullwave's CYH Pullback Strategy combines a 1H trend filter with 15-minute execution. The 1H trend filter is a volatility-based trailing line plotted on the 1H chart; when price holds above it, the filter reads "up," and when a 1H candle closes below it, the filter would flip to "down." This morning that trend filter reads UP, with the trend line itself sitting at $115.28.
On the position side, the indicator is in a long state, with its latest event being a long entry recorded on Oct 2, 01:00 UTC near $118.85. The indicator has remained in that long state since then. Structurally, the 1H chart is showing a pullback phase inside the broader uptrend — exactly the condition the indicator is designed to watch for before considering an add-on entry.
For readers unfamiliar with the mechanics: an add-on entry is a second (or later) entry the indicator may flag when price pulls back within the established trend, rather than reversing it. A partial exit, on the other hand, is a signal the indicator produces when a move extends further than the pullback phase, trimming part of the open exposure rather than closing it outright. Both are chart markers and alert conditions — the indicator does not place or manage orders itself; any action is taken manually by whoever is watching the chart. Right now, the indicator's own state shows no add-on or partial-exit event, just the long entry from Oct 2 and the ongoing pullback structure.
Key levels on the chart
- $123.77 — 7-day high
- $120.91 — 24h high
- $115.28 — Indicator 1H trend line
- $115.21 — 24h low
These four levels frame today's chart: the two highs mark where price has recently struggled over different lookback windows, while the two lower levels mark both the 24h low and the indicator's own trend line, which sit close together just below current price.
Solana ecosystem and official updates
Solana Foundation Launches Solana DvP, an Atomic Settlement Program Built for Financial Institutions (Oct 6, 2026): The Solana Foundation launched Solana DvP, an open-source, MIT-licensed delivery-versus-payment settlement program for financial institutions, developed with input from J.P. Morgan. It enables atomic onchain settlement with finality in seconds. Read more on solana.com
Firedancer Mainnet Release v26.09.6 (Oct 6, 2026): Firedancer released mainnet-ready version v26.09.6, improving validator behavior under degraded network conditions, fixing performance issues that caused validator stalls, and resolving rare identity switch bugs. Read more on Firedancer (GitHub)
Breakpoint 2026: A guide to getting oriented (Part 1) (Sep 18, 2026): Solana's flagship annual conference, Breakpoint, will take place in London on November 15-17, 2026 at Olympia Convention Centre, gathering over 7,000 people from 100+ countries. Read more on solana.com
Separately, status.solana.com currently reports All Systems Operational across the network.
What to watch next
If a 1H candle closes below the indicator's trend line at $115.28, the trend filter would flip from up to down, which would also put price below the 24h low of $115.21 and the 7-day low of $115.21. On the upside, a move back toward the 24h high of $120.91 would bring price closer to the 7-day high of $123.77, a level SOL has not reclaimed over the past week. As long as price holds above $115.28, the 1H structure continues to read as a pullback inside the existing uptrend rather than a trend change, and the indicator's long state remains unchanged from its Oct 2, 01:00 UTC entry.