SOL Chart Note Oct 7: Pullwave Tracks Long State Above $115.28
SOL holds near $120.70 as Pullwave's 1H trend filter stays up and the indicator remains in a long state since Oct 2.
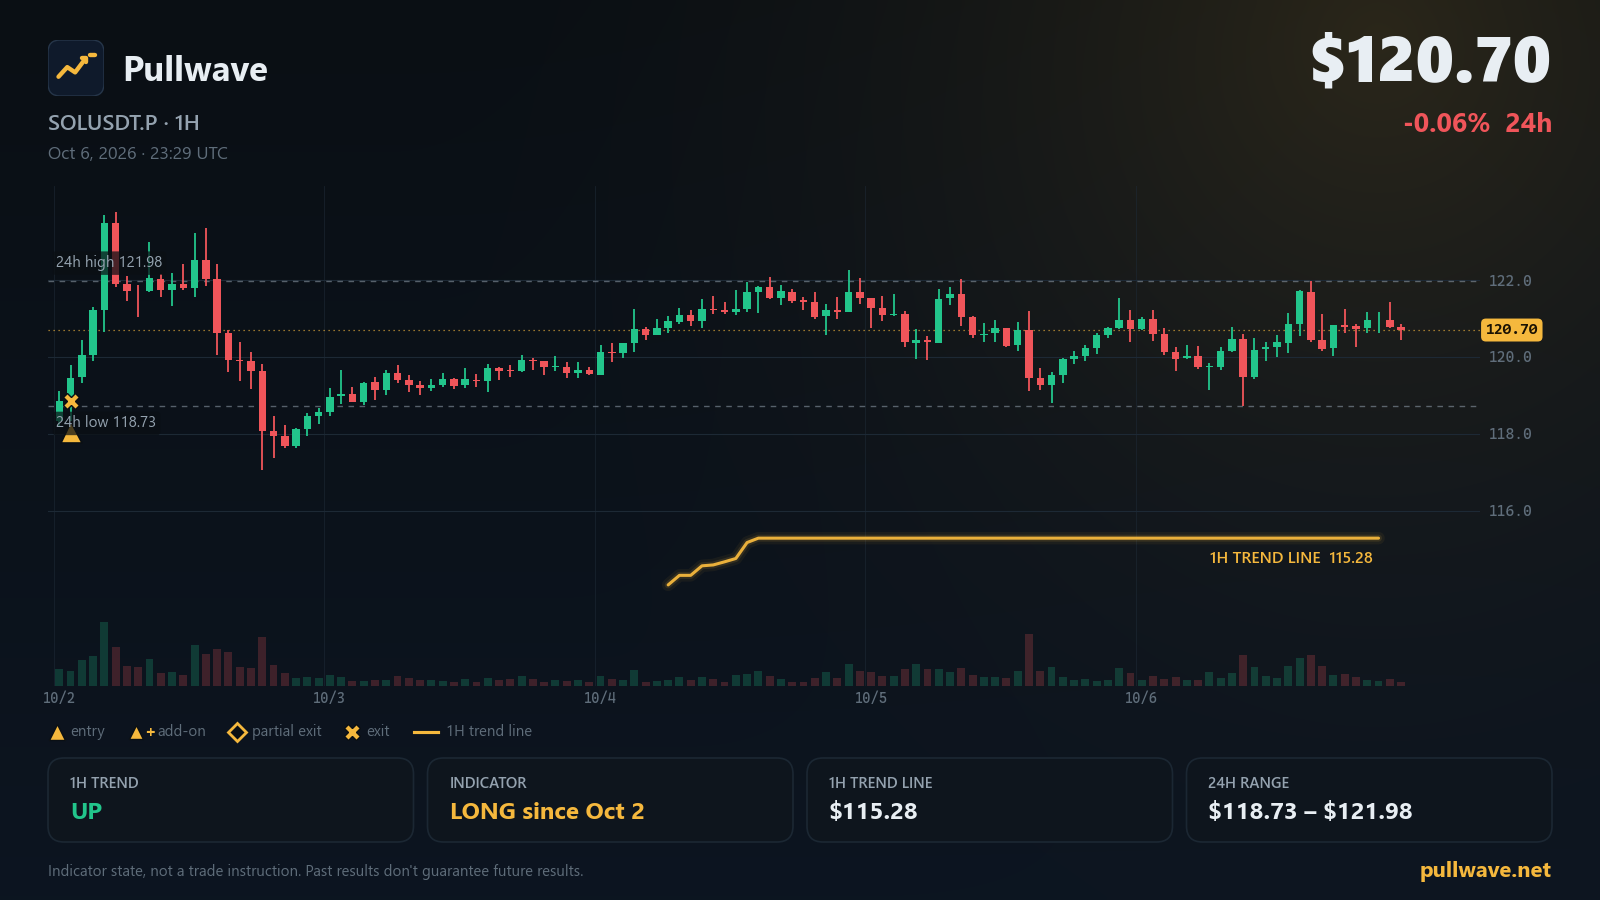
Key levels
- 7-day high123.77
- 24h high121.98
- 24h low118.73
- 7-day low116.63
- Indicator 1H trend line115.28A 1H close beyond this line flips the indicator's 1H trend filter.
- 1H trend
- Up
- Indicator position
- Long since Oct 2
- Last indicator event
- Entry (long) · 118.85 · Oct 2
- 1H trend line
- 115.28
SOL's perpetual futures market is holding inside a tight range this morning, with the Pullwave CYH Pullback Strategy still reading the broader structure as a pullback inside an uptrend. Below is a plain-language look at what the indicator is showing on the SOLUSDT.P chart, the levels worth watching, and the latest official Solana updates.
Market snapshot
SOL USDⓈ-margined perpetual futures (SOLUSDT.P) last traded at $120.70, down -0.06% over the past 24 hours. The 24-hour range spans from a low of $118.73 to a high of $121.98, while the 7-day range runs from $116.63 to $123.77. The latest funding rate reads 0.0100%, and open interest sits at 8,305,969 SOL (about $1,003M), down -0.19% over the last 24 hours.
What the Pullwave indicator shows
Pullwave's CYH Pullback Strategy combines a 1H trend filter with 15-minute execution. The 1H trend filter is a volatility-based trailing line plotted on the 1H chart; as long as price holds above it, the filter reads UP, and a 1H candle close below it would flip the filter to DOWN. As of this morning, that line sits at $115.28, and the 1H trend filter is reading UP.
On top of that filter, the indicator looks for pullbacks inside the prevailing trend on the 15-minute chart. When conditions line up, it can mark an add-on entry — essentially a second point on the chart where the indicator's logic sees the pullback resolving back in the trend's favor. When a move extends far enough, the indicator can also mark a partial exit, scaling down exposure rather than closing everything at once. All of this is rules-based: fixed price-and-volume conditions, not AI, and the indicator only draws these signals on the chart — any order placement is done by the person using it.
Right now, the indicator's position state is LONG, dating back to its entry near $118.85 on Oct 2, 01:00 UTC (10/2 10:00 KST). The 1H structure remains a pullback phase inside the uptrend, meaning the broader trend reading hasn't changed even as price consolidates.
Key levels on the chart
- $123.77 — 7-day high
- $121.98 — 24h high
- $118.73 — 24h low
- $116.63 — 7-day low
- $115.28 — Indicator 1H trend line
Solana ecosystem and official updates
Firedancer Mainnet Release v26.09.6 (2026-10-06): Firedancer released mainnet version v26.09.6, improving validator behavior during degraded network conditions, reducing validator stalls, and fixing rare identity switch bugs. Firedancer (GitHub)
Solana Foundation Launches Solana DvP, an Atomic Settlement Program Built for Financial Institutions (2026-10-06): Solana Foundation launched Solana DvP, an open-source escrow program for atomic delivery-versus-payment settlement, developed with input from J.P. Morgan, aimed at financial institutions. solana.com
Breakpoint 2026: A guide to getting oriented (Part 1) (2026-09-18): Breakpoint 2026, Solana's annual conference, will be held in London on November 15–17 at Olympia Convention Centre, gathering over 7,000 people from 100+ countries. solana.com
Separately, status.solana.com currently reports All Systems Operational across the network.
What to watch next
If a 1H candle closes below the $115.28 trend line, Pullwave's 1H trend filter would flip from UP to DOWN, which would mark a shift in the indicator's broader trend reading while it remains in its current long state. If price pushes back up toward the $121.98 24-hour high or the $123.77 7-day high, that would put the chart back near the top of its recent range, a zone where the indicator's partial-exit logic could become relevant if the move extends. On the downside, a move toward the $118.73 24-hour low or the $116.63 7-day low would bring price closer to the $115.28 trend line itself, the level that defines whether the current pullback phase stays intact or gives way to a trend-filter flip. None of this is a forecast — it's simply where the defined levels sit relative to the indicator's current state, for anyone watching the SOLUSDT.P chart alongside Pullwave today.