SOL Chart Note — Oct 6: Pullwave Reads the 1H Pullback
SOL holds near $120.77 as Pullwave's 1H trend filter stays up and the indicator sits in a long state during a pullback.
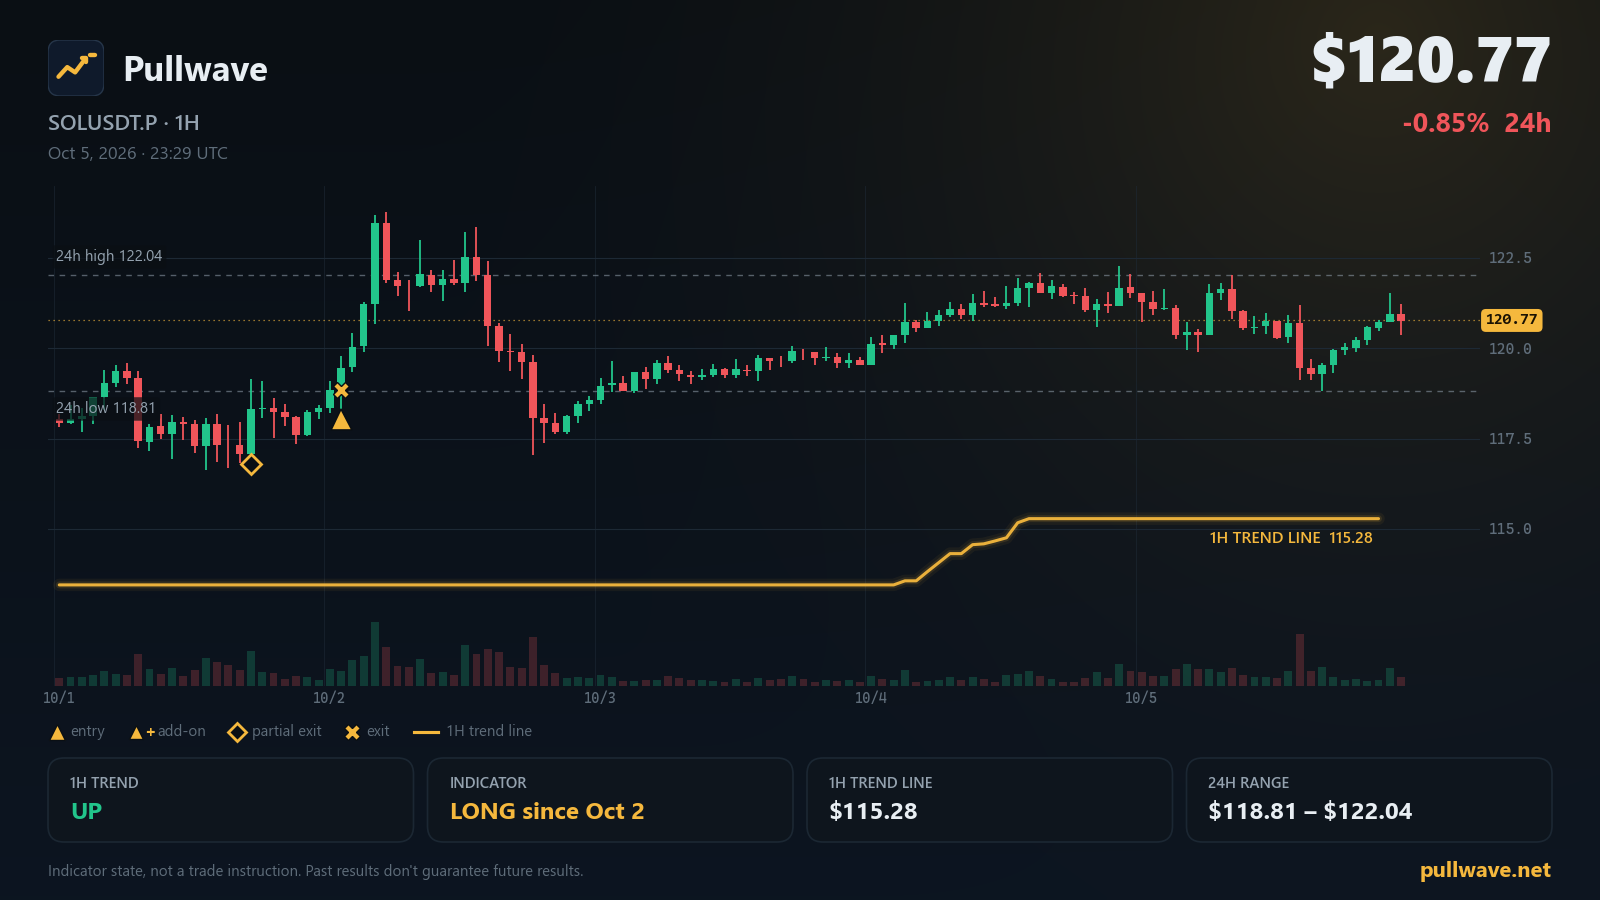
Key levels
- 7-day high123.77
- 24h high122.04
- 24h low118.81
- 7-day low116.25
- Indicator 1H trend line115.28A 1H close beyond this line flips the indicator's 1H trend filter.
- 1H trend
- Up
- Indicator position
- Long since Oct 2
- Last indicator event
- Entry (long) · 118.85 · Oct 2
- 1H trend line
- 115.28
SOL perpetual futures are trading in a tight band this morning, holding above the week's low while funding stays near flat. Below is a plain-language read of what Pullwave's CYH Pullback Strategy indicator is showing on the SOL chart right now, along with the levels worth watching.
Market snapshot
SOLUSDT.P last traded at $120.77, down 0.85% over the past 24 hours. The 24-hour range spans from a low of $118.81 to a high of $122.04, while the broader 7-day range runs from $116.25 to $123.77. Funding sits near zero at 0.00046%, and open interest is 8,298,537 SOL (about $1,002M), down 3.84% over the past 24 hours.
What the Pullwave indicator shows
Pullwave's CYH Pullback Strategy runs a 1H trend filter underneath its 15m execution logic. The 1H trend filter is a volatility-based trailing line plotted on the 1-hour chart; as long as price stays above that line, the filter reads as trending up, and if a 1H candle closes below it, the filter would flip to down. As of this morning, that filter reads UP, with the 1H trend line sitting at $115.28.
On the position side, the indicator has been in a long state since Oct 2, 01:00 UTC, and the current 1H structure is described as a pullback phase inside the uptrend — price pulling back toward the trend line without closing beneath it.
Two mechanics worth understanding if you're watching the chart: an add-on entry is a second (or later) entry the indicator may mark when price pulls back inside an existing uptrend and the add-on conditions table lines up, effectively a note that conditions matched the rule set again. A partial exit is a marked reduction the indicator shows when a move extends further than its trigger level, without implying the position is fully closed. Both are chart markings produced by fixed price-and-volume rules — the indicator does not place orders, and any decision about what to do with that information rests with the person looking at the chart.
Key levels on the chart
- $123.77 — 7-day high
- $122.04 — 24h high
- $118.81 — 24h low
- $116.25 — 7-day low
- $115.28 — Indicator 1H trend line
Solana ecosystem and official updates
Network status from status.solana.com shows All Systems Operational, with no incidents reported.
Solana x AI: The Democratization Layer (Oct 2, 2026) — The Solana Foundation outlines a thesis that Solana can serve as a "democratization layer" for AI, offering permissionless access to compute, training, identity, memory and machine-native payments. Read on solana.com
Breakpoint 2026: A guide to getting oriented (Part 1) (Sep 18, 2026) — Solana's flagship annual conference, Breakpoint, will be held in London on November 15–17, 2026 at the Olympia Convention Centre, expecting over 7,000 attendees from 100+ countries. Read on solana.com
What to watch next
A few conditional observations based strictly on the levels above, with no forecast implied:
- If a 1H candle closes below $115.28, the indicator's 1H trend filter would flip from up to down, which would change the backdrop the current long state is operating under.
- If price pushes back up toward $122.04 or beyond it toward $123.77, that would mean price is retesting the upper part of this week's range rather than continuing the current pullback.
- If price instead slips toward $118.81 or further down to $116.25, that would mean the pullback is extending deeper into this week's range, bringing price closer to the $115.28 trend line.
- With funding near zero and open interest down 3.84% over the past day, the current move looks more like a range adjustment than a heavily leveraged push in either direction — worth keeping in mind alongside whatever the 1H trend line does next.
None of the above is a signal to act on; it's simply how the current price sits relative to the levels already on the chart. Anyone following along can watch how price behaves around $115.28, $118.81, $122.04 and $123.77 to see which of these conditions plays out first.