SOL Chart Note Oct 5: Pullwave Indicator Stays Long
SOL perpetual futures update for Oct 5 with Pullwave's 1H trend line, key levels, and Solana network news.
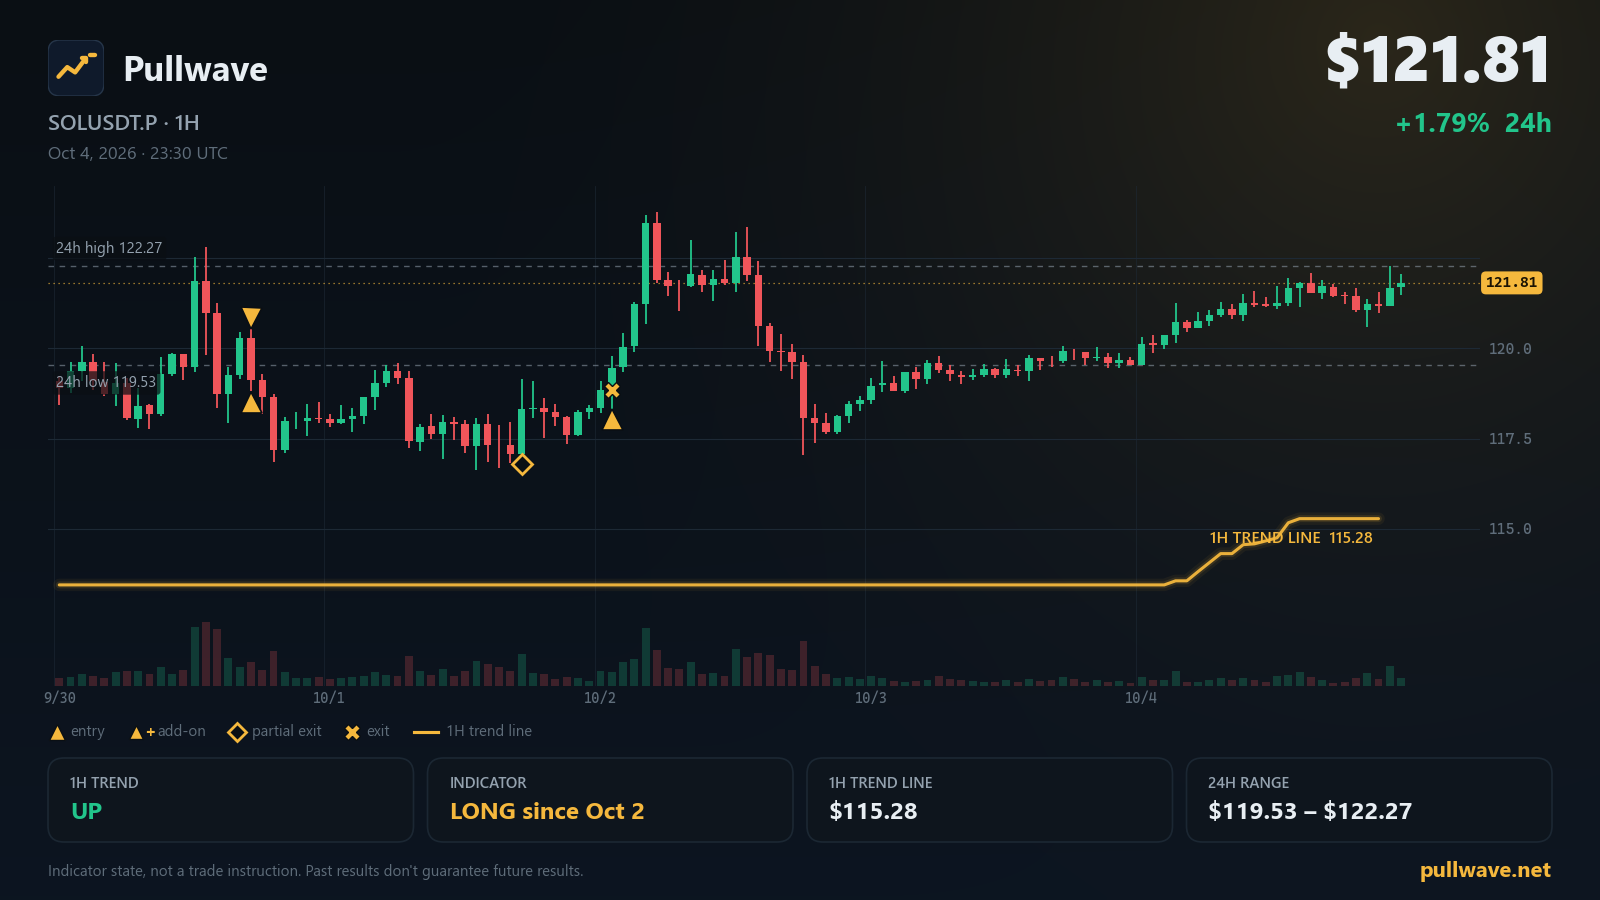
Key levels
- 7-day high123.77
- 24h high122.27
- 24h low119.53
- 7-day low116.25
- Indicator 1H trend line115.28A 1H close beyond this line flips the indicator's 1H trend filter.
- 1H trend
- Up
- Indicator position
- Long since Oct 2
- Last indicator event
- Entry (long) · 118.85 · Oct 2
- 1H trend line
- 115.28
SOL USDⓈ-margined perpetual futures are trading at $121.81 this morning, up 1.79% over the past 24 hours. Open interest has climbed alongside price, and the Pullwave CYH Pullback Strategy indicator remains in a long state on the SOLUSDT.P chart. Here's what the chart and the indicator are showing, plus the latest official Solana updates.
Market snapshot
SOLUSDT.P last traded at $121.81, a 1.79% change over the past 24 hours. The 24h high sits at $122.27 and the 24h low at $119.53. Looking further back, the 7-day high is $123.77 and the 7-day low is $116.25. The latest funding rate reads 0.0100%, and open interest stands at 8,751,951 SOL (about $1,066M), up 4.98% over the past 24 hours.
What the Pullwave indicator shows
The Pullwave CYH Pullback Strategy indicator combines a 1H trend filter with 15-minute execution. The 1H trend filter is a volatility-based trailing line plotted on the 1H chart; it flips from up to down (or back) only when a 1H candle closes on the other side of that line. Right now that filter reads UP, and the 1H trend line itself is marked at $115.28 — if a 1H candle were to close below that level, the trend filter would flip to DOWN.
On the 15m chart, the indicator has been in a long state since Oct 2, 01:00 UTC, when its latest entry event fired near $118.85. The current 1H structure is described as a pullback phase inside the broader uptrend. In this logic, a "pullback" is simply price retracing toward the trend line after an advance; while that continues, the indicator may trigger an add-on entry, which means it can mark an additional position on top of the existing long if its fixed price-and-volume rules line up again. Separately, the indicator takes partial exits when a move extends far enough from the trend line — these are marked directly on the chart along with an add-on conditions table that lays out what conditions still need to be met. None of this is a signal to act; it is simply how the tool is currently reading the chart. The user places any orders themselves, and the rules behind these markers are fixed price-and-volume logic, not AI.
Key levels on the chart
- $123.77 — 7-day high
- $122.27 — 24h high
- $119.53 — 24h low
- $116.25 — 7-day low
- $115.28 — Indicator 1H trend line
Solana ecosystem and official updates
Slot Time Reduction Effects (Sep 28, 2026): Solana reduced its slot time target from 400ms to 250ms; on-chain data shows skip rate remains stable and low, dead time from skips shrinks, and the p99 maximal leadership interval dropped from roughly 3 seconds to roughly 2 seconds. Read more at solana.com
Firedancer Mainnet Release v26.09.5 (Sep 28, 2026): Firedancer released mainnet-ready version v26.09.5, a client update that fixes a startup issue on some Linux distributions. Read more on Firedancer (GitHub)
Breakpoint 2026: A guide to getting oriented (Part 1) (Sep 18, 2026): Solana's flagship conference, Breakpoint, will be held in London on November 15–17, 2026 at Olympia Convention Centre, expecting over 7,000 attendees from more than 100 countries. Read more at solana.com
Separately, status.solana.com currently reports All Systems Operational for the network.
What to watch next
The most direct trigger to watch remains the $115.28 level: a 1H candle closing below the indicator's 1H trend line would flip the trend filter from UP to DOWN, which would change the broader context the indicator is working within. On the upside, price would need to clear the 24h high of $122.27 and then the 7-day high of $123.77 to move beyond the recent range entirely. On the downside, the 24h low of $119.53 and the 7-day low of $116.25 mark the levels price has already tested over the past week; a close back below either would put the current pullback phase under more pressure, while the market continuing to hold above the $115.28 trend line would keep the 1H structure consistent with its current pullback-inside-uptrend description. Traders following the chart can watch how price behaves around these specific levels rather than anticipating any particular outcome.