SOL Chart Watch, Oct 3: Pullwave Indicator Holds Long State
SOL trades near $118.45 as Pullwave's indicator holds a long state with its 1H trend line at $113.45.
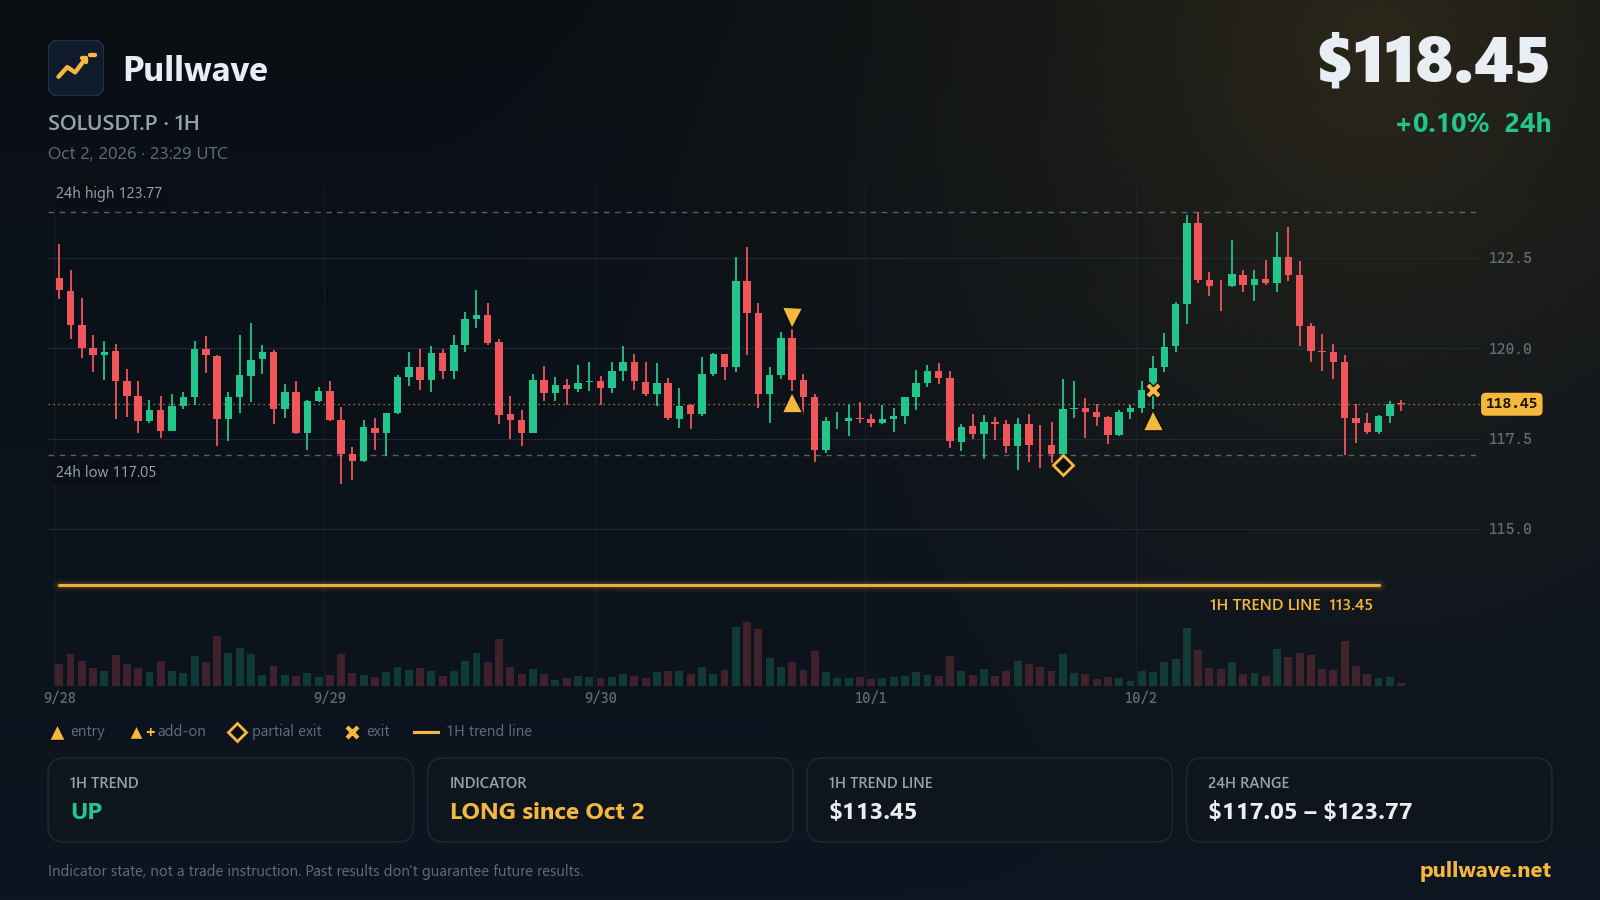
Key levels
- 7-day high124.99
- 24h high123.77
- 24h low117.05
- 7-day low116.25
- Indicator 1H trend line113.45A 1H close beyond this line flips the indicator's 1H trend filter.
- 1H trend
- Up
- Indicator position
- Long since Oct 2
- Last indicator event
- Entry (long) · 118.85 · Oct 2
- 1H trend line
- 113.45
SOL spent the past day chopping inside a wide range while Pullwave's CYH Pullback Strategy continues to track a pullback inside an established uptrend on the 1H chart. Here's a plain-language read of where price sits, what the indicator is showing, and the official Solana updates worth knowing about.
Market snapshot
SOL USDⓈ-margined perpetual futures (SOLUSDT.P) last traded at $118.45, up 0.10% over the past 24 hours. The 24h range ran from a low of $117.05 to a high of $123.77, while the broader 7-day range spans a low of $116.25 to a high of $124.99. The latest funding rate reads -0.0058%, and open interest stands at 8,395,337 SOL (about $995M), up 2.92% over the past 24 hours.
What the Pullwave indicator shows
The CYH Pullback Strategy runs a 1H trend filter — a volatility-based trailing line plotted on the 1H chart — alongside 15m execution logic. The 1H trend filter currently reads UP, and the trend line sits at $113.45. In plain terms, if a 1H candle were to close below that line, the indicator's trend filter would flip from up to down, which changes how the tool treats future setups.
The indicator's position state is a long state, active since Oct 2, 01:00 UTC. Price action since then has moved into what the indicator classifies as a pullback phase inside the uptrend — meaning the broader trend reading remains up, but short-term price has pulled back rather than continuing to push higher.
Two mechanics worth understanding if you're new to how this indicator behaves: an add-on entry is a rule that lets the indicator add to an existing position when price pulls back inside the trend and specific conditions on the add-on table line up. A partial exit is the opposite — it trims part of a position once a move extends far enough that the indicator's rules call for taking some size off. Neither action is a signal to act on its own; they're simply how the tool's logic reacts to price and volume as the chart develops. The indicator draws these entries, add-ons and exits directly on the chart along with an add-on conditions table, so the reasoning behind any state change is visible rather than hidden.
Key levels on the chart
- $124.99 — 7-day high
- $123.77 — 24h high
- $118.45 — last traded price
- $117.05 — 24h low
- $116.25 — 7-day low
- $113.45 — Indicator 1H trend line
Solana ecosystem and official updates
Network status from status.solana.com currently reads All Systems Operational, with no incidents reported.
Slot Time Reduction Effects (2026-09-28): Solana's slot time target has been reduced from 400ms to 250ms. On-chain data shows the skip rate remains stable and the p99 maximal leader interval dropped from about 3 seconds to 2 seconds, though vote latency increased in Asia and South America. Read more — solana.com
Breakpoint 2026: A guide to getting oriented (Part 1) (2026-09-18): Solana's Breakpoint 2026 conference will take place in London on November 15–17 at Olympia Convention Centre, bringing together over 7,000 people from more than 100 countries. Read more — solana.com
Firedancer Mainnet Release v26.09.5 (2026-09-28): Firedancer released mainnet-ready version v26.09.5, fixing a startup issue on some Linux distributions. Read more — Firedancer (GitHub)
What to watch next
The indicator's 1H trend filter stays up as long as a 1H close holds above the $113.45 trend line; a 1H close below that level would be what flips the filter to down. On the upside, the $123.77 24h high and the $124.99 7-day high mark the levels price would need to clear to establish fresh highs beyond the recent range. On the downside, a move through the $117.05 24h low toward the $116.25 7-day low would put price closer to testing the broader 7-day range floor, though it would still sit above the $113.45 trend line unless that level is also breached on a 1H close. Because the indicator currently reads a pullback phase inside an up-trending structure, how price behaves between the $113.45 trend line and the $123.77–$124.99 upper levels is the range worth watching for any change in the indicator's add-on or exit conditions.
SOL Chart Watch, Oct 3: Pullwave Indicator Holds Long State SOL trades near $118.45 as Pullwave's indicator holds a long state with its 1H trend line at $113.45. ["sol", "solana", "solusdt", "tradingview", "pullwave", "crypto-futures", "technical-analysis"]