SOL Chart Note Oct 2: Pullwave Tracks a Short State Inside an Uptrend
SOL holds near $118.31 as Pullwave's indicator stays short with the 1H trend filter still pointing up. Levels, news and what to watch.
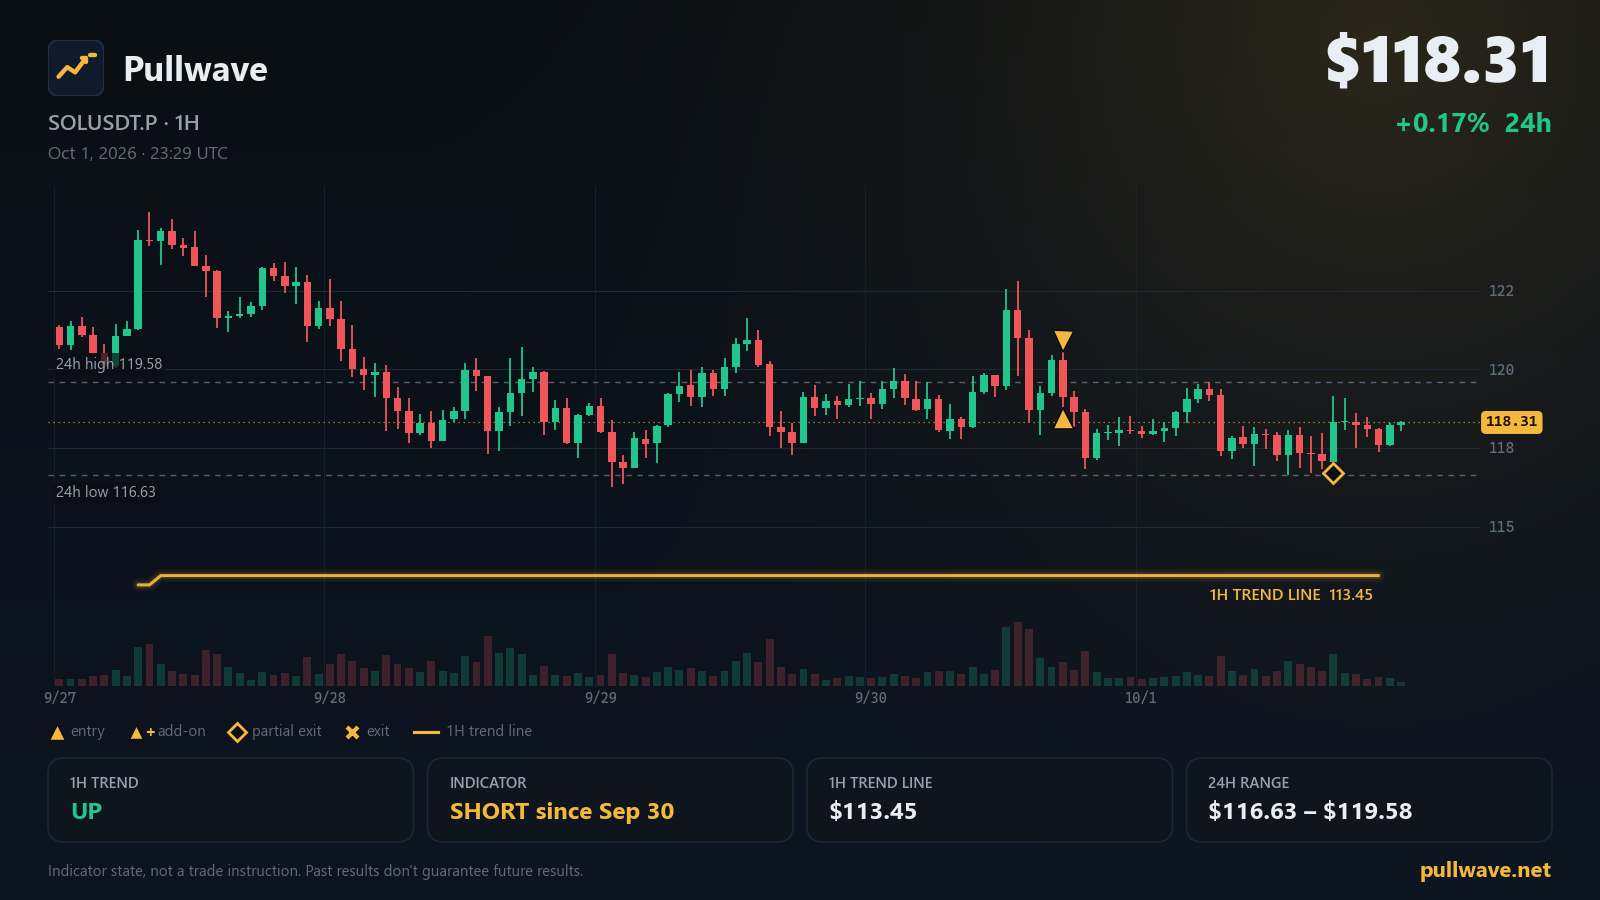
Key levels
- 7-day high124.99
- 24h high119.58
- 24h low116.63
- 7-day low115.80
- Indicator 1H trend line113.45A 1H close beyond this line flips the indicator's 1H trend filter.
- 1H trend
- Up
- Indicator position
- Short since Sep 30
- Last indicator event
- Partial exit (short) · 117.07 · Oct 1
- 1H trend line
- 113.45
SOL is holding inside last week's range this morning, with the indicator's 1H trend filter still pointing up even as its own position state sits short. Below is a plain-language read of the chart, the Pullwave indicator's current state, and the official Solana news worth knowing about today.
Market snapshot
SOLUSDT.P last traded at $118.31, up 0.17% over 24 hours. The 24-hour range ran from a low of $116.63 to a high of $119.58. Zooming out to the past 7 days, SOL touched a high of $124.99 and a low of $115.80. Futures positioning shows a latest funding rate of 0.0050% and open interest of 8,154,544 SOL (about $965M), which is down 2.39% over the past 24 hours.
What the Pullwave indicator shows
Pullwave's CYH Pullback Strategy runs a 1H trend filter alongside 15-minute execution. The trend filter is a volatility-based trailing line plotted on the 1H chart; when price stays on one side of it, the filter reads as trending that direction. Right now that 1H trend filter reads UP, with the trend line itself sitting at $113.45. If a 1H candle were to close below that line, the indicator's trend filter would flip to DOWN.
Separately, the indicator's own position state is short, a state that has been active since Sep 30, 17:45 UTC. This short state and the UP trend filter are not contradictory in the indicator's logic — the 1H structure is currently described as a pullback phase inside the broader uptrend, which is exactly the kind of pullback the strategy is designed to trade against on lower timeframes.
Two mechanics worth understanding if you're watching the chart: an add-on entry is when the indicator adds to an existing position after a pullback that stays consistent with the 1H trend; a partial exit is when the indicator closes part of a position as a move extends, locking in part of the position size rather than all of it. The most recent event on the chart was a partial exit on the short state, which occurred Oct 1, 17:00 UTC near $117.07. No add-on entries have been logged on this short state so far.
The add-on conditions table on the chart tracks whether current price action qualifies for a further add-on, and alerts can notify you when entries, add-ons or exits trigger — though placing or managing any order remains entirely up to the trader.
Key levels on the chart
- $124.99 — 7-day high
- $119.58 — 24h high
- $116.63 — 24h low
- $115.80 — 7-day low
- $113.45 — Indicator 1H trend line
Solana ecosystem and official updates
Solana's network status page (status.solana.com) currently shows All Systems Operational.
Slot Time Reduction Effects (2026-09-28): Solana reduced its slot time target from 400ms to 250ms; on-chain data shows a stable skip rate, less dead time from skipped slots, and a reduced window for single-leader value extraction, though vote latency increased in Asia and South America. Read more at solana.com
Firedancer Mainnet Release v26.09.5 (2026-09-28): Firedancer released mainnet-ready version v26.09.5, which fixes a startup issue on some Linux distributions. Read more on Firedancer (GitHub)
Breakpoint 2026: A guide to getting oriented (Part 1) (2026-09-18): Solana's flagship Breakpoint conference will be held in London on November 15-17, 2026 at the Olympia Convention Centre, expecting over 7,000 attendees from 100+ countries. Read more at solana.com
What to watch next
If price pushes back up toward the $119.58 24h high, that would put SOL closer to retesting the upper part of its recent range without yet reaching the $124.99 7-day high. If instead price slips toward the $116.63 24h low or further down to the $115.80 7-day low, that would bring price closer to the $113.45 indicator trend line — and a 1H close below $113.45 is the specific condition that would flip the indicator's trend filter from UP to DOWN. Until either of those thresholds is crossed, the chart remains in the pullback phase described above, with the indicator's short state and partial-exit history as the only confirmed events on record. Funding at 0.0050% and a 2.39% dip in open interest are additional data points to watch alongside price, though neither changes the indicator's own trend-filter or position-state readings on its own.