SOL Chart Update Sep 30: Pullwave Indicator Stays Long
SOL trades near $119.63 as Pullwave's 1H trend filter holds up and price sits in a pullback above its trend line.
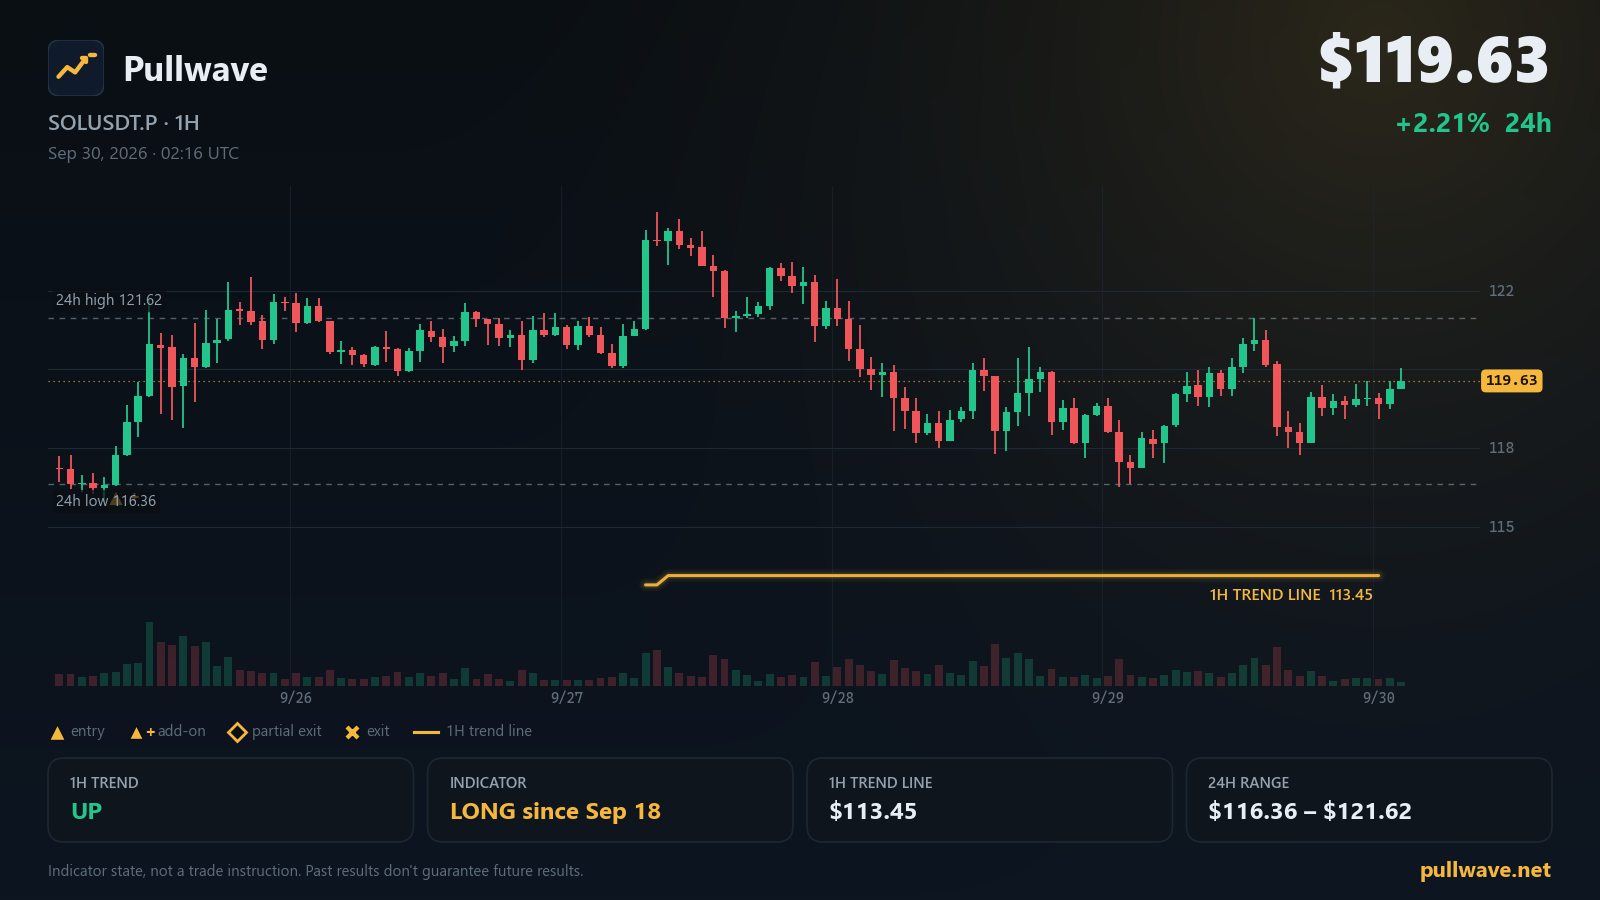
Key levels
- 7-day high124.99
- 24h high121.62
- 24h low116.36
- Indicator 1H trend line113.45A 1H close beyond this line flips the indicator's 1H trend filter.
- 7-day low112.39
- 1H trend
- Up
- Indicator position
- Long since Sep 18
- Last indicator event
- Add-on (long) · 116.32 · Sep 25
- 1H trend line
- 113.45
SOL is trading at $119.63 on the SOLUSDT.P perpetual market, up 2.21% over the last 24 hours. This note walks through what the Pullwave CYH Pullback Strategy indicator is currently showing on the SOL chart, the key levels visible right now, and the latest official Solana updates.
Market snapshot
SOL's last price is $119.63, with a 24h change of +2.21%. The 24h high is $121.62 and the 24h low is $116.36. Zooming out, the 7-day high is $124.99 and the 7-day low is $112.39. Funding is near zero, and open interest sits at 8,190,222 SOL (about $980M), up 0.05% over the last 24 hours.
What the Pullwave indicator shows
The Pullwave CYH Pullback Strategy indicator combines a 1H trend filter with 15m execution timing. The 1H trend filter is a volatility-based trailing line plotted on the 1-hour chart; as long as price holds above it, the filter reads as an uptrend. Right now that 1H trend filter reads UP, and the 1H trend line itself sits at $113.45. If a 1H candle were to close below $113.45, the indicator's trend filter would flip to DOWN.
On the position side, the indicator has been in a long state since Sep 18, 09:00 UTC. An "add-on entry" is a rule inside the indicator that lets it add to an existing position when price pulls back inside the prevailing trend without breaking the 1H trend line — it's a way of describing more exposure being added to the same directional read, not a new independent call. The most recent add-on entry (long) was logged on Sep 25, 08:00 UTC, near $116.32.
The indicator also has a partial-exit mechanism: when a move extends far enough, it can close part of the position while the underlying trend read remains unchanged. As of this morning, the 1H structure is described as a pullback phase inside the uptrend — price has pulled back somewhat from recent highs but hasn't closed below the 1H trend line.
None of this is a suggestion to take any action; it's simply a description of what the indicator's rules currently register on the chart. Any decision about orders remains with the person using it.
Key levels on the chart
- $124.99 — 7-day high
- $121.62 — 24h high
- $116.36 — 24h low
- $113.45 — Indicator 1H trend line
- $112.39 — 7-day low
Solana ecosystem and official updates
Slot Time Reduction Effects (2026-09-28): Solana now targets 250ms slot times, down from 400ms; skip rate remains stable and low while p99 leader-control time dropped from about 3s to about 2s. solana.com
Firedancer Mainnet Release v26.09.5 (2026-09-28): Firedancer released mainnet-ready version v26.09.5, fixing a startup issue on some Linux distributions. Firedancer (GitHub)
Stocks Go Onchain: What the SEC's Innovation Exemption Means for Solana (2026-09-23): The SEC issued a five-year order allowing tokenized stocks with full shareholder rights to trade on public, permissionless blockchains without exchange registration; Solana's architecture for this is already live. solana.com
Breakpoint 2026: A guide to getting oriented (Part 1) (2026-09-18): Breakpoint 2026 will be held in London on November 15–17 at Olympia Convention Centre, gathering over 7,000 people from 100+ countries. solana.com
Network status on status.solana.com currently reads "All Systems Operational."
What to watch next
If a 1H candle closes below the indicator's trend line at $113.45, the trend filter would flip from UP to DOWN, which would change how the indicator reads the broader structure. Until then, the pullback phase inside the uptrend continues to be the operative read.
On the upside, price action approaching the 24h high at $121.62 or the 7-day high at $124.99 would put SOL back near the top of its recent range, while a move back toward the 24h low at $116.36 or the 7-day low at $112.39 would bring price closer to the 1H trend line at $113.45 — the level that matters most for whether the indicator's trend filter stays intact or flips. Watching how price behaves around these specific levels, rather than guessing at outcomes, is the practical way to read the chart alongside the indicator's current state.