SOL Chart Note, Oct 14: Pullwave Tracks the $112.80 Trend Line
SOL perpetual futures sit at $106.70 as Pullwave's indicator holds a short state below its $112.80 1H trend line.
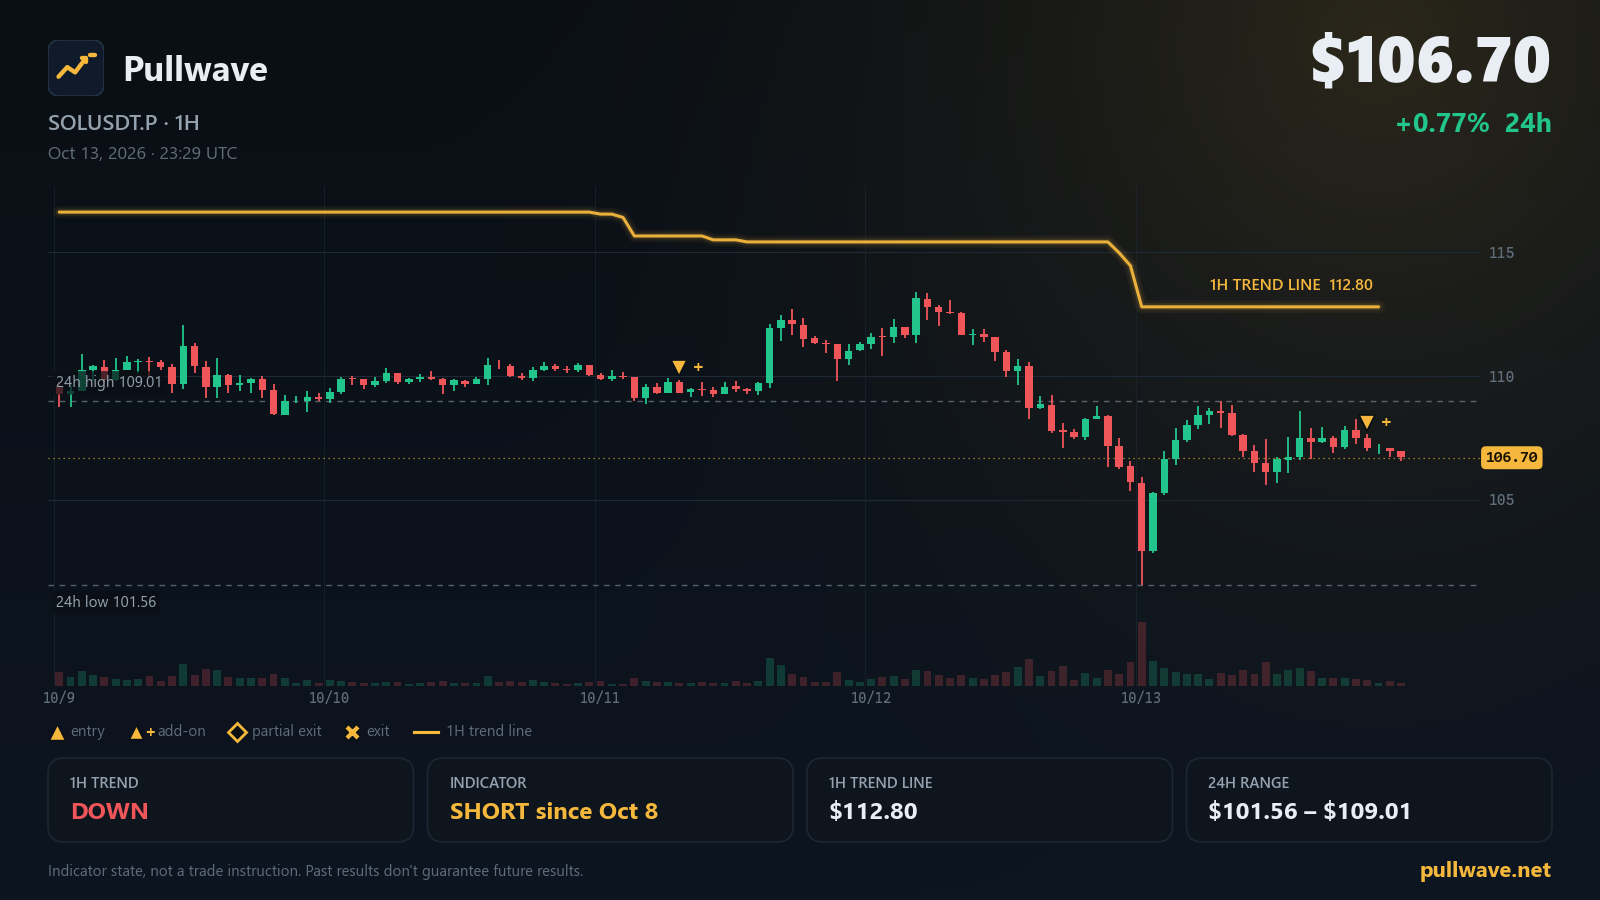
Key levels
- 7-day high120.91
- Indicator 1H trend line112.80A 1H close beyond this line flips the indicator's 1H trend filter.
- 24h high109.01
- 24h low101.56
- 1H trend
- Down
- Indicator position
- Short since Oct 8
- Last indicator event
- Add-on (short) · 107.10 · Oct 13
- 1H trend line
- 112.80
SOL perpetual futures are trading near $106.70 this morning, holding inside a range that has been forming since the market pulled back from its weekly high. Pullwave's CYH Pullback Strategy indicator remains in a short state on the 15m/1H setup, with its 1H trend filter still reading down. Here is what the chart and the indicator are showing right now.
Market snapshot
SOLUSDT.P last traded at $106.70, up 0.77% over the past 24 hours. The 24h range sits between a high of $109.01 and a low of $101.56. Looking back seven days, price swung between a high of $120.91 and a low of $101.56. The latest funding rate reads 0.0100%, and open interest stands at 8,506,761 SOL (about $908M), down 1.19% over the past 24 hours.
What the Pullwave indicator shows
Pullwave's CYH Pullback Strategy runs a 1H trend filter alongside 15m execution. The 1H trend filter is a volatility-based trailing line plotted on the 1-hour chart; as long as 1H closes stay on one side of that line, the filter keeps pointing in that direction. Right now the filter reads down, and the indicator's trend line for that filter sits at $112.80. If a 1H candle were to close above that line, the trend filter would flip to up.
The indicator's position state has been short since Oct 8, 11:00 UTC. On Oct 13 at 20:45 UTC, the indicator logged an add-on entry (short) near $107.10. An add-on entry means the indicator's rules found a secondary setup in the same direction as the existing position — in this case, a pullback inside the established downtrend that met its price-and-volume conditions, so the tool marked another entry in the short direction on the chart. The indicator also has logic for partial exits, where it marks taking part of a position off when a move extends far enough in its favor; no such exit has fired since the Oct 13 add-on. Currently, the 1H structure shows a pullback phase inside the broader downtrend, which is the condition the indicator's add-on logic watches for. All entries, add-ons and exits are drawn directly on the chart along with an add-on conditions table, and the indicator can send alerts, though placing or managing any order remains the user's own action.
It's worth repeating that this indicator is not AI-based. It runs on fixed price-and-volume rules applied to the 1H trend line and 15m price action — nothing probabilistic or adaptive about how it decides when to mark an add-on or an exit.
Key levels on the chart
- $120.91 — 7-day high
- $112.80 — Indicator 1H trend line
- $109.01 — 24h high
- $101.56 — 24h low
Solana ecosystem and official updates
Solana Changelog: October 8, 2026 (2026-10-08): Solana activated a feature gate to reduce slot times from 250ms to 200ms, effective one epoch after activation, while web3.js v3 became ready for general use, alongside new Firedancer testnet and mainnet releases. Read more on solana.com
Breakpoint 2026: A guide to getting oriented (Part 1) (2026-09-18): Breakpoint 2026 will take place in London on November 15–17 at Olympia Convention Centre, gathering over 7,000 people from 100+ countries, per the official event guide. Read more on solana.com
Separately, status.solana.com currently reports all systems operational for the Solana network.
What to watch next
If a 1H candle closes above the indicator's trend line at $112.80, the indicator's trend filter would flip from down to up, which would change the directional bias the indicator is currently working from. Until then, the 1H trend filter continues to read down, and the indicator's position state remains short, having last added to that position near $107.10 on Oct 13.
On the price chart, the 24h high of $109.01 and the 7-day high of $120.91 mark the upper levels in play, while the 24h low and 7-day low both sit at $101.56. Price action relative to these levels, together with whether a 1H close forms above or below $112.80, is what would shape the next read on the indicator's trend filter and position state. As always, the indicator's entries, add-ons and any future exits will continue to be drawn on the chart in real time, with the add-on conditions table available for anyone following along to see which conditions are currently met or unmet.