Bitcoin (BTC) KRW Spot Notes for Oct 17: Price Levels and Market Breadth
A look at Bitcoin's KRW spot price on Oct 17, its recent trading range, and the Pullwave indicator's public signal record alongside Korean won market breadth.
- Market
- BTC/KRW spot
- Last price
- ₩109,860,000 (-0.88% 24h)
- Indicator
- Flat since Sep 23
- Signal timeframe
- 4H
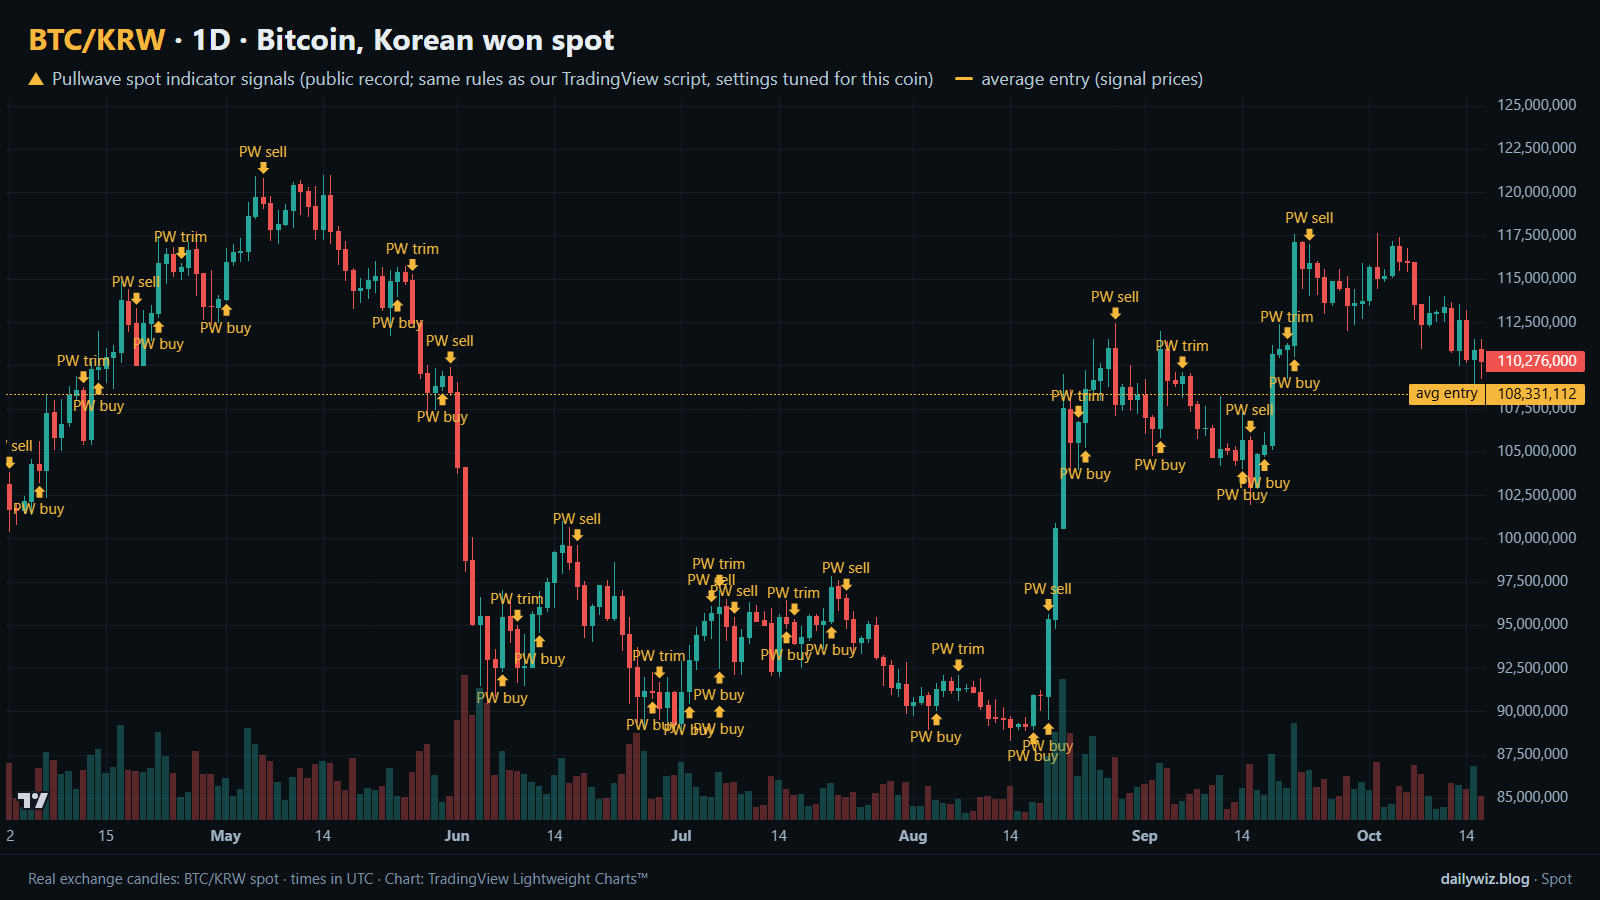
Bitcoin trades in the Korean won (KRW) spot market with a last price of ₩109,860,000 on Oct 17, down -0.88% over the past 24 hours. Trading has ranged between ₩109,257,000 and ₩111,341,000 in that period, with wider 7-day and 30-day ranges noted below. This note covers the current price levels, Korean won market breadth, and the latest public signal record from the Pullwave spot indicator.
Bitcoin in the Korean won market
In the Korean won (KRW) spot market, Bitcoin last traded at ₩109,860,000, down -0.88% over 24 hours, with a 24h range of ₩109,257,000 to ₩111,341,000. The 7-day range sits between ₩108,014,000 and ₩113,980,000, while the 30-day range runs from ₩105,181,000 to ₩117,646,000. Traded value over 24 hours was ₩65.5 billion. Across the broader Korean won market, 296 coins were tracked, with 49 up since 09:00 KST, 219 down, and 28 flat. Bitcoin's share of 24h KRW market value was 7.19%, with global dominance at 59.33%.
- Last price: ₩109,860,000 · 24h change -0.88%
- 24h high / low: ₩111,341,000 / ₩109,257,000
- 7-day high / low: ₩113,980,000 / ₩108,014,000
- 30-day high / low: ₩117,646,000 / ₩105,181,000
- 24h traded value: about ₩65.5 billion
What the Pullwave spot indicator shows
- Current state: flat (waiting in cash) since the sell signal on Sep 23, 16:00 UTC — the marks below are the last completed signal
- Signal timeframe: 4H (settings tuned for this coin — marks can differ from the TradingView indicator's default settings)
- Buy signal: Sep 17, 08:00 UTC · ₩105,216,000
- Partial sell signal: Sep 20, 04:00 UTC · ₩109,763,000
- Add-on buy signal: Sep 21, 12:00 UTC · ₩114,857,000
- Sell signal: Sep 23, 16:00 UTC · ₩114,763,000
- Average entry (signal prices): ₩108,331,112
- Result of this signal: +4.38% (average exit ₩113,070,777)
- Maximum loss after entry (deepest dip): -3.18% (low of ₩104,891,000 on Sep 17)
Calculated from Pullwave spot indicator signal prices; not actual trades. Based on the public record on pullwave.net (published with a 24-hour delay); fees not included.
Recent completed signals
| Buy signal | Sell signal | Result |
|---|---|---|
| 2026-09-17 | 2026-09-23 | +4.38% |
| 2026-09-03 | 2026-09-15 | -2.94% |
| 2026-08-19 | 2026-08-28 | +7.60% |
| 2026-08-04 | 2026-08-19 | -0.51% |
| 2026-07-15 | 2026-07-23 | -0.61% |
The 5 most recent completed signals for this coin, wins and losses as they came (not selected). Signal-based calculation; not actual trades.
Price levels to watch
- If the price closes above ₩111,341,000, watch whether it can approach the 7-day high near ₩113,980,000.
- If the price moves below ₩109,257,000, watch whether it tests the 7-day low near ₩108,014,000.
- If the price breaks below ₩108,014,000, watch whether the 30-day low near ₩105,181,000 comes into view.
- Levels on the chart: ₩117,646,000, ₩113,980,000, ₩111,341,000, ₩109,257,000, ₩108,014,000, ₩105,181,000
This note describes the Pullwave spot indicator's public record (updated on the site with a 24-hour delay). It is not a recommendation to buy or sell.
Chart rendered with TradingView Lightweight Charts™ from real exchange candles. tradingview.com