Bitcoin Cash (BCH) KRW Spot Market Update for Oct 26
Bitcoin Cash trades at ₩372,700 on the Korean won (KRW) spot market, up +2.11% in 24 hours, as the Pullwave indicator stays in a holding state on the 4H chart.
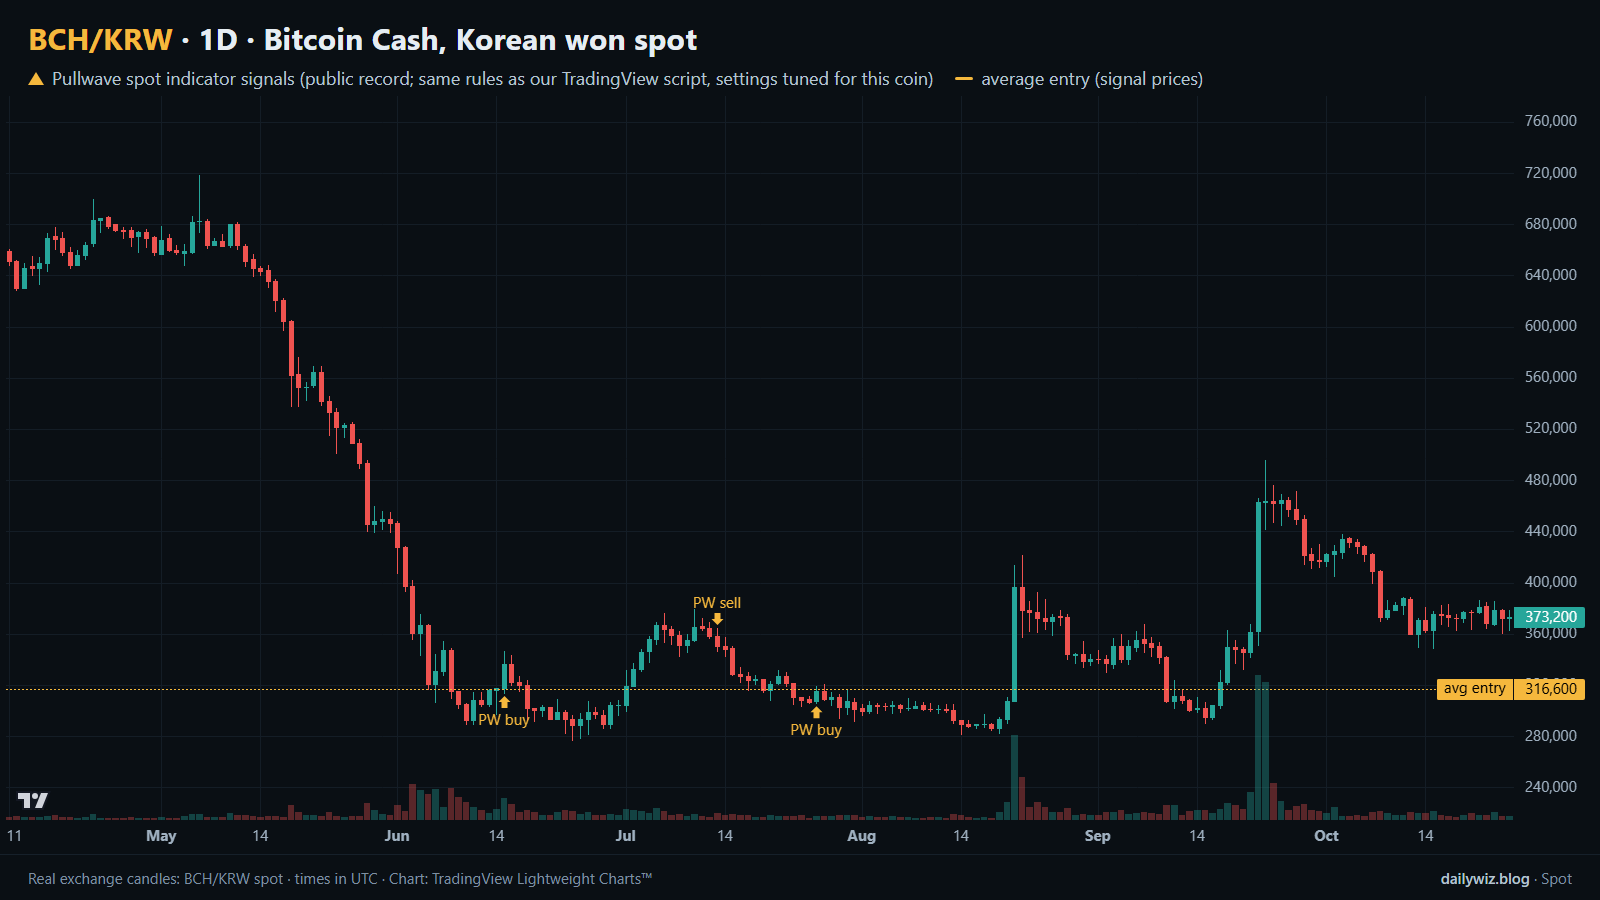
- Market
- BCH/KRW spot
- Last price
- ₩372,700 (+2.11% 24h)
- Indicator
- Holding since Jul 26
- Signal timeframe
- 4H
This note looks at Bitcoin Cash (BCH) on the Korean won (KRW) spot market for Oct 26. It reviews recent price action and the current state of the Pullwave spot indicator on the 4H chart. The note covers the latest signal, a summary of recent signals, and key price levels to watch.
Bitcoin Cash in the Korean won market
Bitcoin Cash (BCH) last traded at ₩372,700 on the Korean won (KRW) spot market, up +2.11% over the past 24 hours, with trading ranging between ₩363,200 and ₩379,700. The price sits -3.50% from the 7-day high of ₩386,200 and +3.33% above the 7-day low of ₩360,700, placing it at 19.3% from the bottom of the 30-day range between ₩349,000 and ₩471,900. The 20-bar average stands at ₩373,025, and price is currently below that level. Traded value over the past 24 hours was ₩2.0 billion.
- Last price: ₩372,700 · 24h change +2.11%
- 24h high / low: ₩379,700 / ₩363,200
- 7-day high / low: ₩386,200 / ₩360,700
- 30-day high / low: ₩471,900 / ₩349,000
- 24h traded value: about ₩2.0 billion
What the Pullwave spot indicator shows
- Current state: holding, since the buy signal on Jul 26, 20:00 UTC
- Signal timeframe: 4H (settings tuned for this coin — marks can differ from the TradingView indicator's default settings)
- Buy signal: Jul 26, 20:00 UTC · ₩316,600
- Average entry (signal prices): ₩316,600
- Move since entry: +17.72% (at the current price ₩372,700)
- Maximum loss after entry (deepest dip): -10.93% (low of ₩282,000 on Aug 14)
Calculated from Pullwave spot indicator signal prices; not actual trades. Based on the public record on pullwave.net (published with a 24-hour delay); fees not included.
Recent completed signals
| Buy signal | Sell signal | Result |
|---|---|---|
| 2026-06-15 | 2026-07-13 | +12.95% |
| 2026-03-04 | 2026-03-26 | +5.24% |
| 2026-01-21 | 2026-02-23 | -9.05% |
| 2025-10-21 | 2025-10-30 | +7.06% |
| 2025-09-02 | 2025-10-10 | +5.79% |
The 5 most recent completed signals for this coin, wins and losses as they came (not selected). Signal-based calculation; not actual trades.
Price levels to watch
- If the price closes above the 7-day high of ₩386,200, watch whether it can extend toward the 30-day high of ₩471,900.
- If the price falls below the 7-day low of ₩360,700, watch whether it moves toward the 30-day low of ₩349,000.
- If the price stays between the 24h low of ₩363,200 and the 24h high of ₩379,700, watch whether that range continues to hold.
- Levels on the chart: ₩471,900, ₩386,200, ₩379,700, ₩363,200, ₩360,700, ₩349,000, ₩316,600
This note describes the Pullwave spot indicator's public record (updated on the site with a 24-hour delay). It is not a recommendation to buy or sell.
Chart rendered with TradingView Lightweight Charts™ from real exchange candles. tradingview.com