Bitcoin Cash (BCH) KRW spot Notes and Signal Update for Oct 9
A look at Bitcoin Cash (BCH) on the Korean won (KRW) spot market for Oct 9, covering the daily range, 30-day structure, and the Pullwave indicator's latest signal record.
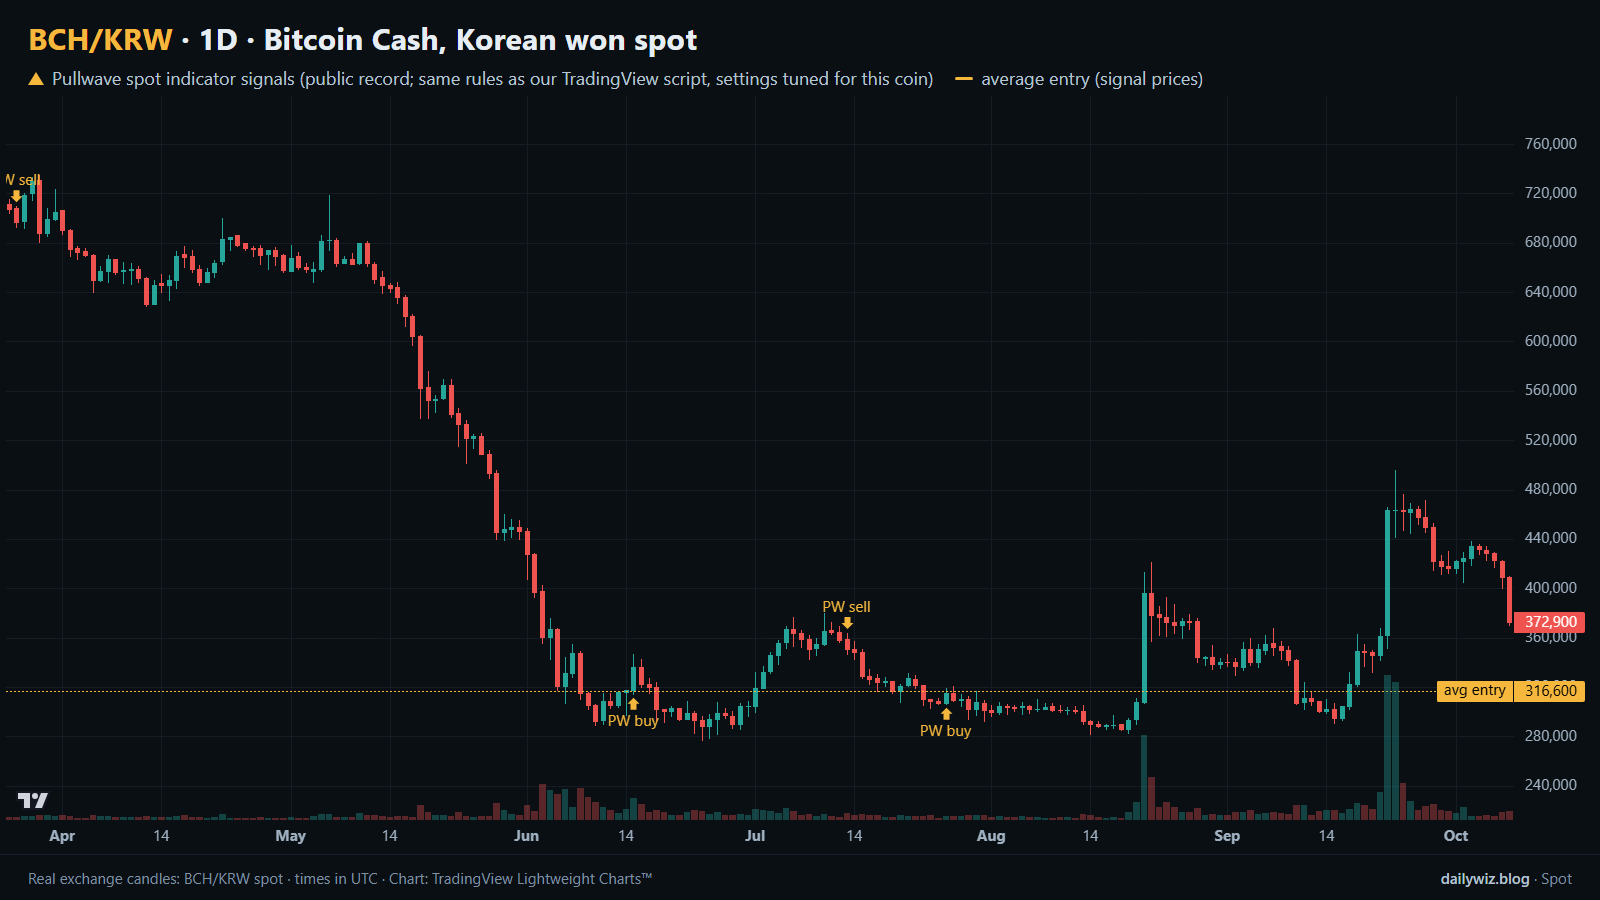
- Market
- BCH/KRW spot
- Last price
- ₩382,500 (-5.32% 24h)
- Indicator
- Holding since Jul 26
- Signal timeframe
- 4H
Bitcoin Cash (BCH) is trading at ₩382,500 on the Korean won (KRW) spot market on Oct 9, down -5.32% over the past 24 hours. The Pullwave spot indicator is currently holding a position on the 4H chart for this coin. This note covers the recent price range, the indicator's latest signal, and a summary of its most recent completed signals.
Bitcoin Cash in the Korean won market
Over the past 24 hours, BCH moved between ₩407,300 and ₩370,000, settling at ₩382,500, down -5.32% on the day. The 7-day range sits between ₩438,000 and ₩370,000, with price now -12.67% below the 7-day high and +3.38% above the 7-day low. Across the 30-day window of ₩496,000 to ₩290,600, price is positioned 44.7% from the bottom. Price remains below the 20-bar average of ₩405,670, and traded value over the past 24 hours was ₩5.3 billion.
- Last price: ₩382,500 · 24h change -5.32%
- 24h high / low: ₩407,300 / ₩370,000
- 7-day high / low: ₩438,000 / ₩370,000
- 30-day high / low: ₩496,000 / ₩290,600
- 24h traded value: about ₩5.3 billion
What the Pullwave spot indicator shows
- Current state: holding, since the buy signal on Jul 26, 20:00 UTC
- Signal timeframe: 4H (settings tuned for this coin — marks can differ from the TradingView indicator's default settings)
- Buy signal: Jul 26, 20:00 UTC · ₩316,600
- Average entry (signal prices): ₩316,600
- Move since entry: +20.81% (at the current price ₩382,500)
- Maximum loss after entry (deepest dip): -10.93% (low of ₩282,000 on Aug 14)
Calculated from Pullwave spot indicator signal prices; not actual trades. Based on the public record on pullwave.net (published with a 24-hour delay); fees not included.
Recent completed signals
| Buy signal | Sell signal | Result |
|---|---|---|
| 2026-06-15 | 2026-07-13 | +12.95% |
| 2026-03-04 | 2026-03-26 | +5.24% |
| 2026-01-21 | 2026-02-23 | -9.05% |
| 2025-10-21 | 2025-10-30 | +7.06% |
| 2025-09-02 | 2025-10-10 | +5.79% |
The 5 most recent completed signals for this coin, wins and losses as they came (not selected). Signal-based calculation; not actual trades.
Price levels to watch
- If the price closes above ₩407,300, the 24-hour high, watch whether it can move toward the 7-day high at ₩438,000.
- If the price falls below ₩370,000, the 24-hour low, watch whether it approaches the 30-day low at ₩290,600.
- If the price moves back to ₩316,600, watch whether it can later test the 30-day high at ₩496,000.
- Levels on the chart: ₩496,000, ₩438,000, ₩407,300, ₩370,000, ₩316,600, ₩290,600
This note describes the Pullwave spot indicator's public record (updated on the site with a 24-hour delay). It is not a recommendation to buy or sell.
Chart rendered with TradingView Lightweight Charts™ from real exchange candles. tradingview.com