SOL Nov 6: Pullwave 1H Trend Filter Down, Short State Holds
SOL trades at $89.11 after a -6.68% day. The Pullwave 1H trend line sits at $98.49 and the indicator remains in a short state.
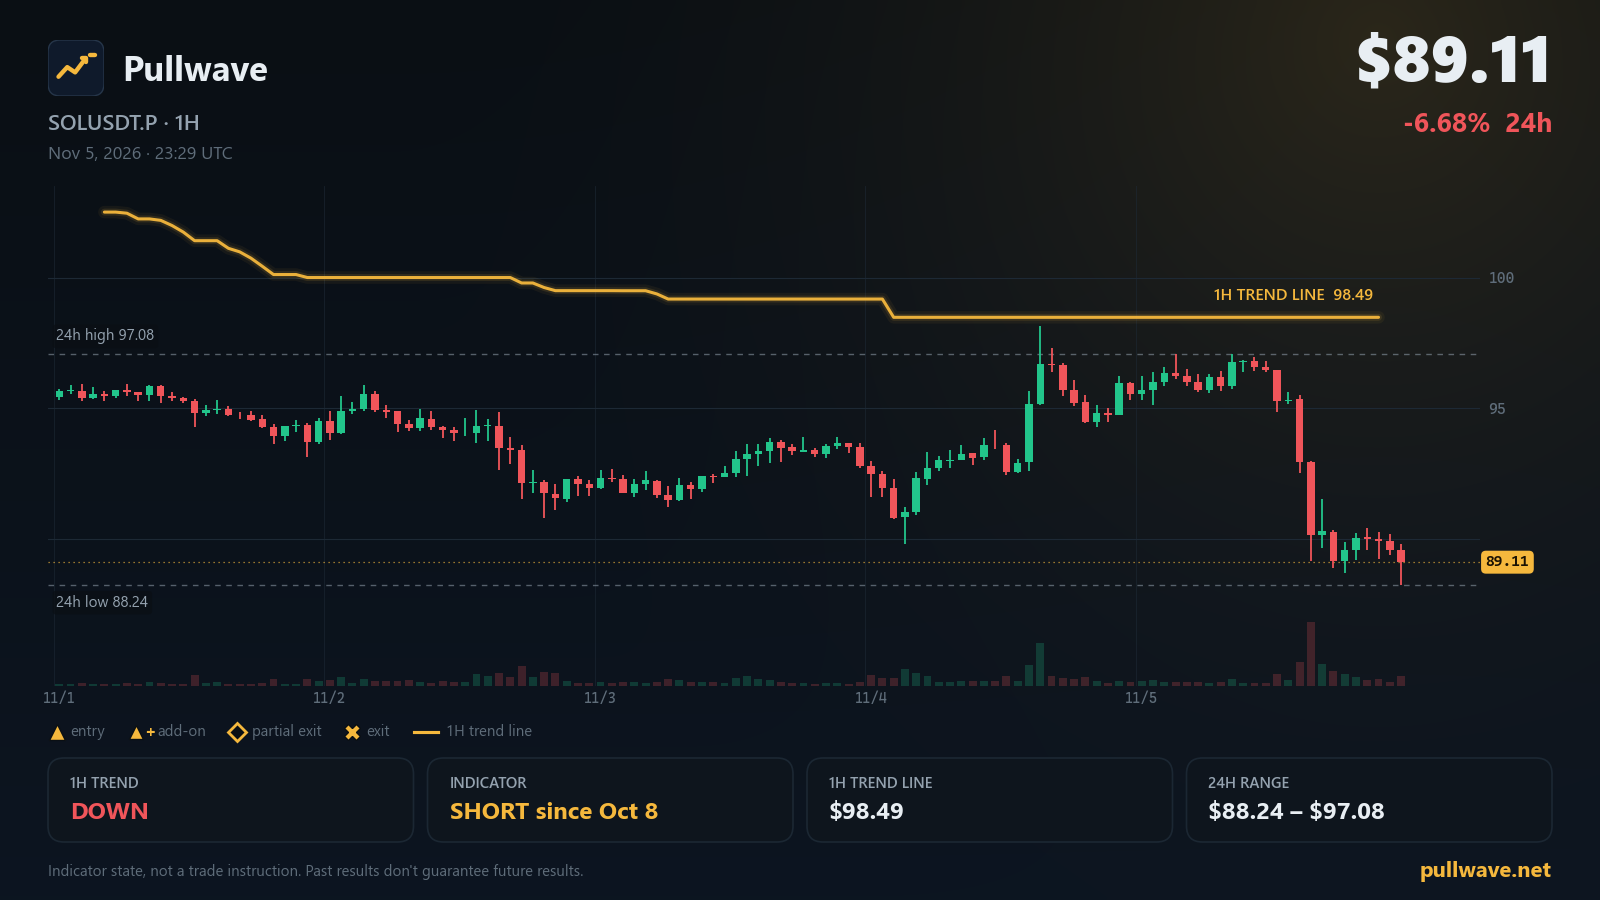
Key levels
- 7-day high98.54
- Indicator 1H trend line98.49A 1H close beyond this line flips the indicator's 1H trend filter.
- 24h high97.08
- 7-day low88.69
- 24h low88.24
- 1H trend
- Down
- Indicator position
- Short since Oct 8
- Last indicator event
- Add-on (short) · 95.78 · Oct 31
- 1H trend line
- 98.49
SOL spent the last 24 hours on the back foot, printing a fresh leg lower while the Pullwave CYH Pullback Strategy stayed in the same state it has held since early October. Nothing about the indicator's posture changed overnight: the 1H trend filter is still pointing down and the trend line is parked well above current price. Here is the chart note for 2026-11-06 (KST), covering the market snapshot, what the indicator is displaying, the levels drawn on the chart, and the official Solana updates from the past days.
Market snapshot
SOL USDⓈ-margined perpetual futures (SOLUSDT.P) last traded at $89.11, a 24h change of -6.68%. The 24h range runs from a high of $97.08 down to a low of $88.24, and the weekly picture is similar in character: the 7-day high stands at $98.54 and the 7-day low at $88.69. Price is therefore sitting in the lower part of its weekly range rather than near the top of it.
Positioning data is quiet rather than stretched. The latest funding rate is about 0%, essentially neutral, which means neither side is paying a meaningful premium to hold exposure right now. Open interest is 9,047,362 SOL, roughly $806M, and it has decreased by -2.52% over the past 24 hours — a modest reduction in outstanding contracts alongside the move lower.
What the Pullwave indicator shows
The Pullwave CYH Pullback Strategy runs on two timeframes. On the 1H chart it plots a volatility-based trailing line that acts as a trend filter: when price action holds under that line, the filter reads DOWN; a 1H candle closing above it would flip the filter to UP. On the 15m chart the strategy handles execution, marking entries, add-on entries and exits directly on the candles. Every one of those marks comes from fixed price-and-volume rules — this is not an AI model, and the indicator never places an order. Anything that happens in an account is placed by the user.
As of this morning, the 1H trend filter is DOWN and the indicator's position state is SHORT, held since Oct 8, 11:00 UTC (10/8 20:00 KST). The most recent event on the chart was an add-on entry on the short side at Oct 31, 20:00 UTC (11/1 05:00 KST), printed near $95.78.
Two terms are worth defining plainly. An add-on entry is what the indicator prints when price pulls back inside an existing trend and then resumes in the direction the filter already favours — it is a second mark layered onto the same directional state rather than a new, independent signal. A partial exit is the opposite housekeeping mark: when a move extends, the indicator flags that a portion of the position would be reduced under its rules, leaving the rest to track the trend. Both appear as labels on the chart, and the add-on conditions table on the right-hand side shows which conditions are currently satisfied.
Key levels on the chart
- $98.54 — 7-day high
- $98.49 — Indicator 1H trend line
- $97.08 — 24h high
- $88.69 — 7-day low
- $88.24 — 24h low
The clustering at the top is notable: the 1H trend line at $98.49 sits just under the 7-day high at $98.54, so the level that would flip the trend filter and the level that caps the week's range are close neighbours. Beneath price, the 7-day low at $88.69 and the 24h low at $88.24 form the lower reference band.
Solana ecosystem and official updates
Network status on status.solana.com currently reads All Systems Operational.
Firedancer Mainnet Release v26.10.6 — 2026-11-05. Firedancer released mainnet-ready version v26.10.6, adding support for the loaderv3_programdata_size_floor feature. Source: Firedancer (GitHub)
Release v4.4.1 — 2026-11-05. Agave released stable version v4.4.1, recommended for general adoption as well as Testnet and Devnet, including security ignores and CI fixes. Source: Anza Agave (GitHub)
Solana Breakpoint 2026 Adds Revolut Chair, Former Prime Minister, Former Chancellor and City Leaders to London Lineup — 2026-10-26. Breakpoint 2026, taking place November 15–17 at Olympia London, added speakers including Revolut Chair Martin Gilbert, former Chancellor Sajid Javid, and former Prime Minister Boris Johnson. Source: solana.com
What to watch next
The single mechanical condition on the chart today is the 1H trend line at $98.49. If a 1H candle closes above it, the indicator's trend filter would flip from DOWN to UP; until that happens, the filter stays as it is regardless of intraday swings. Just above that sits the 7-day high at $98.54, and below it the 24h high at $97.08 marks where the most recent attempt upward stalled.
On the downside, the 24h low at $88.24 and the 7-day low at $88.69 are the two reference points already on the chart. Trade beneath them would mean price is extending past the lowest prints of the past day and week, while a recovery back through them would place price inside the body of the weekly range again. With funding at about 0% and open interest down -2.52%, there is no crowding signal in the positioning data to read alongside those levels — the chart structure is doing the talking for now.