SOL Chart Note — Nov 3: Pullwave Trend Line Sits at $99.51
SOL trades at $91.80 after a -2.41% day. The Pullwave 1H trend filter is DOWN with its trend line at $99.51, and the indicator is in a short state.
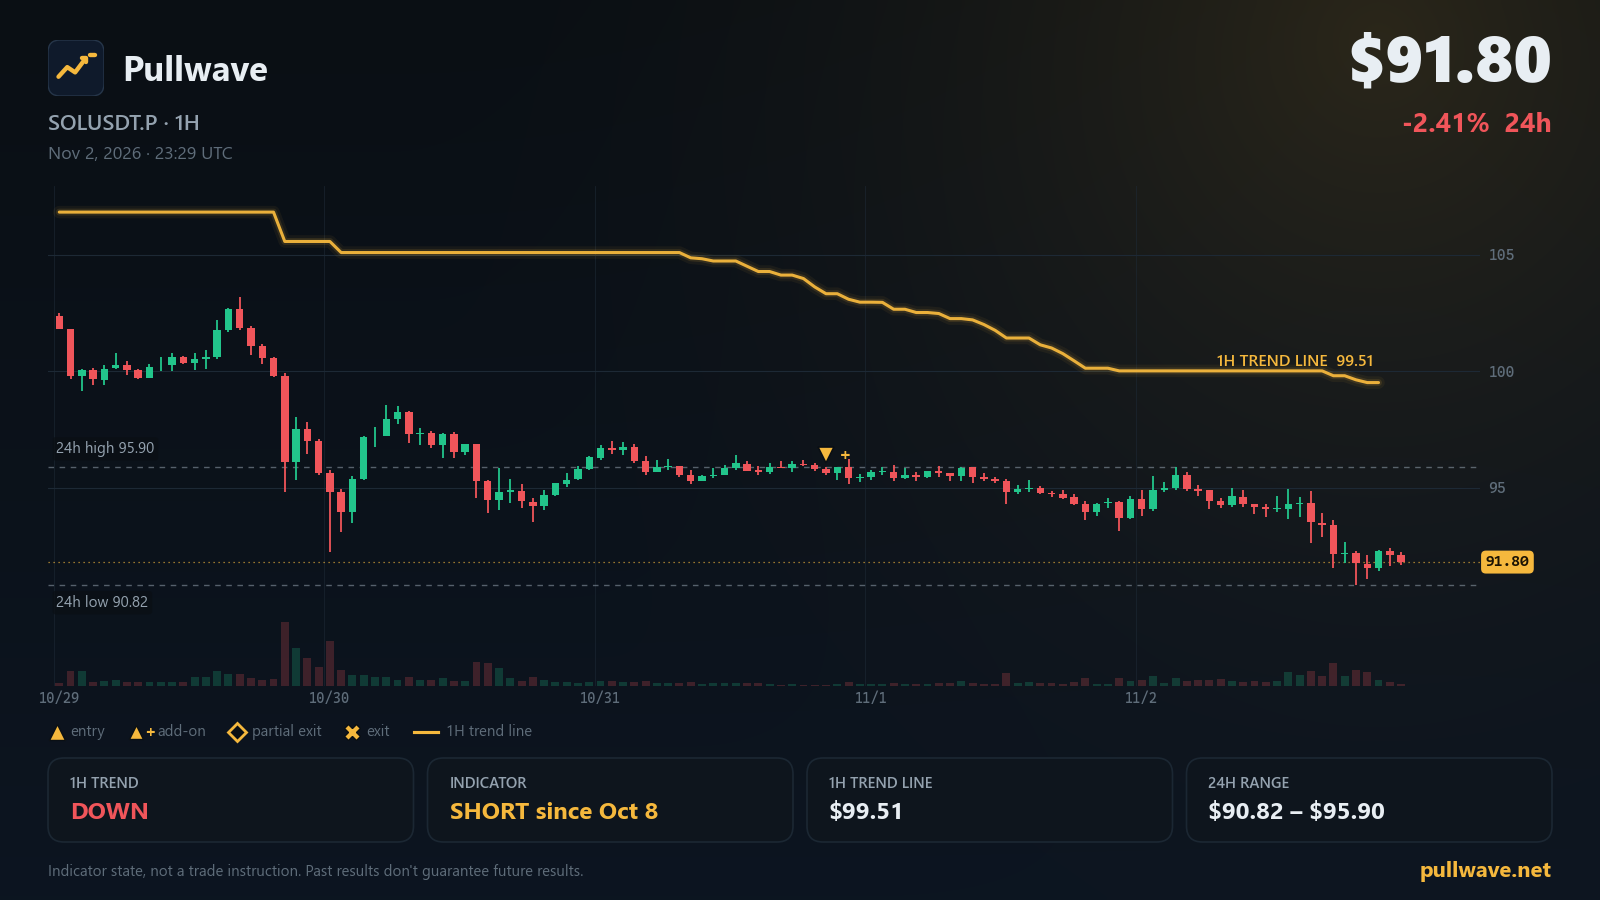
Key levels
- 7-day high103.89
- Indicator 1H trend line99.51A 1H close beyond this line flips the indicator's 1H trend filter.
- 24h high95.90
- 24h low90.82
- 1H trend
- Down
- Indicator position
- Short since Oct 8
- Last indicator event
- Add-on (short) · 95.78 · Oct 31
- 1H trend line
- 99.51
SOL is starting the session near the lower edge of its recent range, with the perpetual market printing $91.80 after a soft 24 hours. The Pullwave CYH Pullback Strategy on SOLUSDT.P is still reading the higher timeframe as down, and its 1H trend line sits well above the current tape. Below is the state of the chart as of this morning (KST, 2026-11-03), plus the official Solana updates that landed over the past week.
Market snapshot
SOL USDⓈ-margined perpetual futures (SOLUSDT.P) last traded at $91.80, a 24h change of -2.41%. The 24h high is $95.90 and the 24h low is $90.82, which is also the 7-day low — in other words, yesterday's weakness pushed price into the bottom of the weekly range rather than bouncing off the middle of it. The 7-day high stands at $103.89, so the market has spent the week working lower from that level.
Positioning data is mixed rather than one-sided. The latest funding rate is 0.0100%, and open interest sits at 9,439,846 SOL (about $867M), up +3.87% over 24 hours. More open contracts while price drifts toward the weekly low simply means more participants are engaged around this area; it says nothing by itself about direction.
On the network side, status.solana.com reports All Systems Operational.
What the Pullwave indicator shows
The Pullwave CYH Pullback Strategy runs a two-layer structure. The first layer is a 1H trend filter: a volatility-based trailing line plotted on the 1-hour chart. That line moves with price but only in one direction at a time, and it defines which side of the market the indicator is willing to work. Right now the 1H trend filter reads DOWN, and the trend line sits at $99.51. If a 1H candle closed above $99.51, the trend filter would flip to UP; until that happens, the higher timeframe reading stays as it is.
The second layer is 15m execution. Inside an established trend, the indicator waits for a pullback — a counter-move against the prevailing direction — and marks entries from fixed price-and-volume rules. It is not AI and it does not forecast; the rules are mechanical and the user places any orders themselves.
Two terms show up often on the chart. An add-on entry is a second marker printed in the same direction as the existing position after a qualifying pullback, so the indicator's exposure to that trend increases. A partial exit is the opposite idea: when a move extends, the indicator marks a reduction of the position rather than closing the whole thing at once, leaving the remainder to follow the trend filter.
As of this morning, the indicator's position state is SHORT, held since Oct 8, 11:00 UTC (10/8 20:00 KST). The most recent indicator event was an add-on short entry on Oct 31, 20:00 UTC (11/1 05:00 KST) near $95.78. The add-on conditions table on the chart tracks which conditions are currently satisfied, and alerts can be created on a paid TradingView plan (Essential or higher), while simply displaying the indicator works on the free plan.
Key levels on the chart
- $103.89 — 7-day high
- $99.51 — Indicator 1H trend line
- $95.90 — 24h high
- $90.82 — 24h low
Solana ecosystem and official updates
Solana Changelog: October 29, 2026 — Oct 29, 2026. Solana's weekly Changelog reports the CLI decoupling from cargo-build-sbf, the rollout of offchain message signing, and new releases across Agave, Firedancer, Superbank, Solana Kit, and Token-2022. solana.com
Solana Breakpoint 2026 Adds Revolut Chair, Former Prime Minister, Former Chancellor and City Leaders to London Lineup — Oct 26, 2026. Solana Foundation announced additional speakers for Breakpoint 2026, including Revolut Chair Martin Gilbert, former UK Prime Minister Boris Johnson, and former Chancellor Sajid Javid, ahead of the event at Olympia London on 15–17 November. solana.com
Release v4.4.0 — Oct 28, 2026. Anza released Agave v4.4.0, a stable version recommended for mainnet, testnet and devnet, including updates to vote account encoding, pinned build tools, and a feature rekey for SIMD-550. Anza Agave (GitHub)
Firedancer Mainnet Release v26.10.5 — Oct 27, 2026. Firedancer shipped mainnet-ready release v26.10.5, improving snapshot peer selection, block packing performance, and voting validator connection reliability, while fixing a rare crash at the epoch boundary. Firedancer (GitHub)
What to watch next
The cleanest marker on the chart is the trend line itself. If a 1H candle closes above $99.51, the indicator's trend filter would flip to UP and the higher-timeframe context it uses for 15m execution would change with it. As long as 1H closes stay under that line, the filter remains in its current DOWN reading.
Between here and there sits the $95.90 24h high, the level price would first have to reclaim for any approach toward the trend line to even begin, and above that the $103.89 7-day high, which marks where the week's distribution started.
On the other side, $90.82 is doing double duty as both the 24h low and the 7-day low. A session that holds above it keeps the week's base intact; trade accepted beneath it would put SOL at levels not seen in the past seven days, and the indicator would continue to mark its own events — add-ons after qualifying pullbacks, partial exits when a move extends — strictly from its fixed rules rather than from any of these levels in isolation.