SOL Chart Note Oct 30: 1H Trend Filter Down, Price $96.63
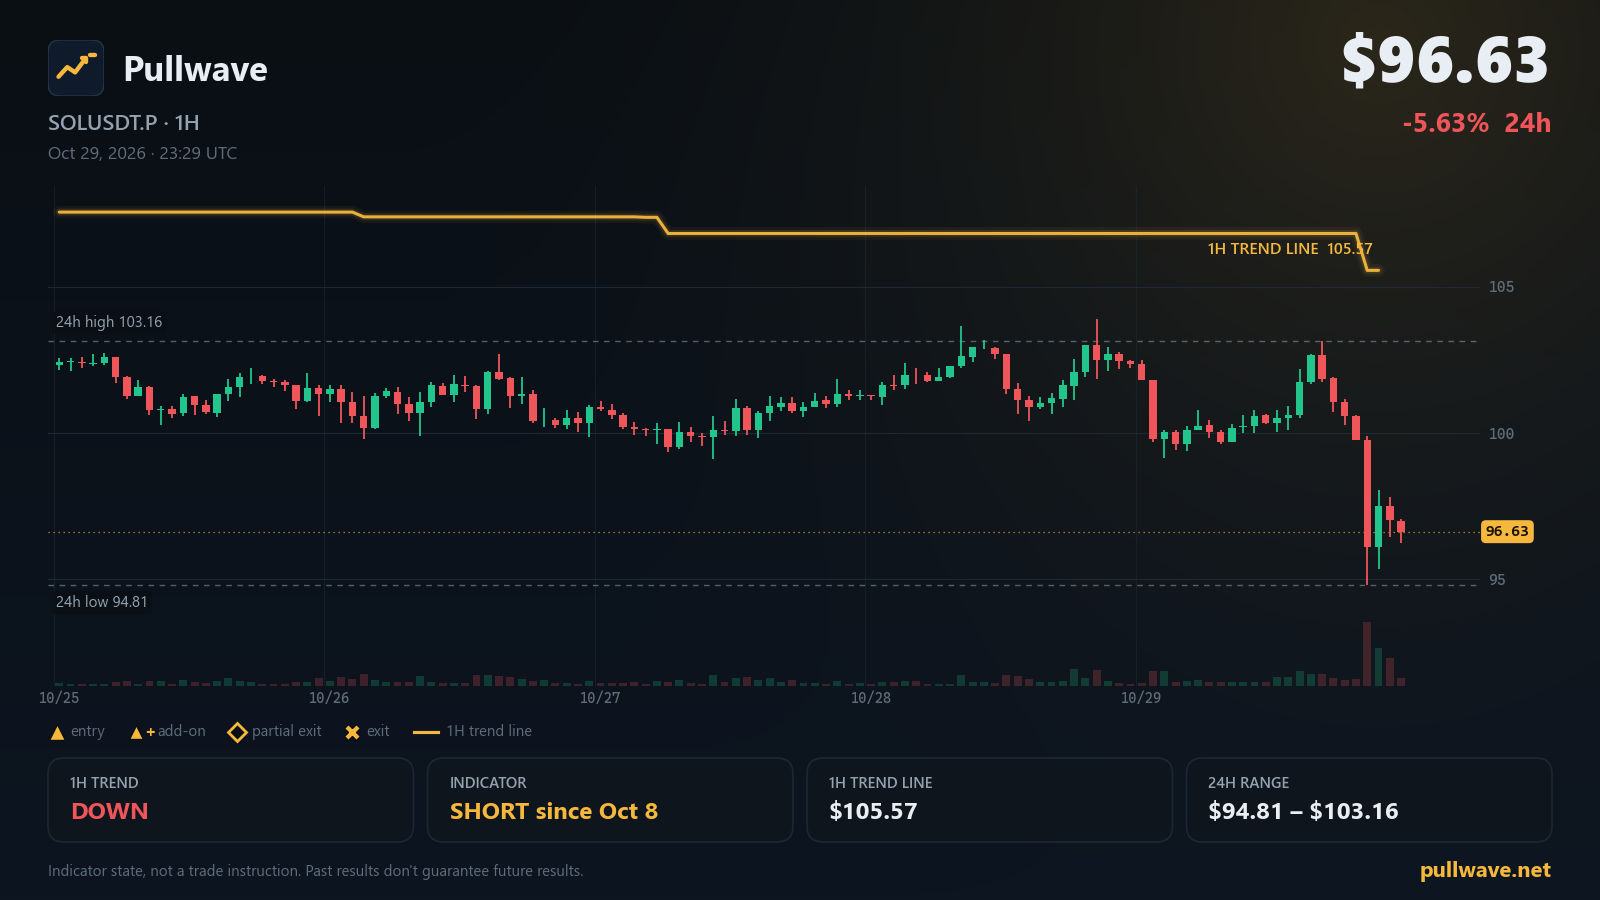
SOL trades at $96.63 after a -5.63% day. The Pullwave indicator is in a short state with its 1H trend line at $105.57.
Key levels
- Indicator 1H trend line105.57A 1H close beyond this line flips the indicator's 1H trend filter.
- 7-day high105.22
- 24h high103.16
- 24h low94.81
- 1H trend
- Down
- Indicator position
- Short since Oct 8
- Last indicator event
- Add-on (short) · 104.34 · Oct 23
- 1H trend line
- 105.57
Solana spent the last 24 hours under pressure, with the perpetual futures market printing a 24h change of -5.63% and price sitting at $96.63 as of this morning (KST, 2026-10-30). The Pullwave CYH Pullback Strategy remains in a short state on SOLUSDT.P, and its 1H trend filter is still reading DOWN. Below is the daily read of the chart, the indicator's current state, the levels it is tracking, and the official Solana updates from this week.
Market snapshot
SOL USDⓈ-margined perpetual futures (SOLUSDT.P) last traded at $96.63. The 24h range runs from a low of $94.81 to a high of $103.16, so the session has covered a wide band and price is currently resting in the lower part of it. Stepping back to the week, the 7-day high is $105.22 and the 7-day low is $94.81 — meaning yesterday's low is also the weekly low, and the market is testing the bottom edge of its recent range rather than the top.
Positioning data is cooler than it was a day ago. Open interest stands at 8,442,145 SOL (about $816M), down -7.06% over 24 hours, while the latest funding rate prints at 0.0076%. A falling open interest alongside a falling price generally reflects contracts being closed rather than fresh ones being opened, but that is context, not a signal — the indicator itself does not read funding or open interest.
What the Pullwave indicator shows
The CYH Pullback Strategy runs two layers. The first is a 1H trend filter: a volatility-based trailing line plotted on the one-hour chart that defines which direction the strategy is allowed to work in. Right now that filter reads DOWN, and the trend line sits at $105.57. The line is directional — it only flips when a 1H candle actually closes on the other side of it. If a 1H candle closed above $105.57, the trend filter would flip to UP and the strategy's permitted direction would change with it.
The second layer is 15m execution. Inside an established trend, the indicator waits for price to pull back and then marks an entry on the 15-minute chart. The indicator has been in a short state since Oct 8, 11:00 UTC (10/8 20:00 KST). Its most recent event was an add-on entry (short) printed at Oct 23, 15:15 UTC (10/24 00:15 KST) near $104.34.
Two terms worth defining plainly. An add-on entry is a second marker the indicator prints when price pulls back inside an already-running trend and the add-on conditions table turns green — it is a labelled event on the chart, not an instruction. A partial exit is a marker the indicator prints when the move extends, flagging that part of the tracked position would be reduced under the strategy's fixed rules. Every one of these markers comes from fixed price-and-volume logic. The indicator draws them, optionally fires an alert, and the user decides what to do with that information.
Key levels on the chart
- $105.57 — Indicator 1H trend line
- $105.22 — 7-day high
- $103.16 — 24h high
- $94.81 — 24h low
Solana ecosystem and official updates
Network status at status.solana.com currently reports All Systems Operational.
Release v4.4.0 — 2026-10-28. Agave v4.4.0 shipped as a stable release recommended for 20% mainnet-beta adoption, and is also recommended for Testnet and Devnet. Changes include vote account padding, build SBF pinning, and a SIMD-550 feature rekey. Anza Agave (GitHub)
Firedancer Mainnet Release v26.10.5 — 2026-10-27. Firedancer v26.10.5 was released as mainnet ready, improving snapshot download peer selection, block packing performance, and connection reliability for voting validators. It also fixes a rare crash at the epoch boundary. Firedancer (GitHub)
Solana Changelog: October 29, 2026 — 2026-10-29. The weekly changelog reports that the Solana CLI is decoupling from cargo-build-sbf as offchain message signing ships, alongside new releases for Agave, Firedancer, Superbank, Solana Kit, and Token-2022. solana.com
Solana Breakpoint 2026 Adds Revolut Chair, Former Prime Minister, Former Chancellor and City Leaders to London Lineup — 2026-10-26. The Solana Foundation announced additional speakers for Breakpoint 2026, taking place 15–17 November at Olympia London, including Revolut Chair Martin Gilbert, former Chancellor Sajid Javid, and former Prime Minister Boris Johnson. The theme is Token Supercycle. solana.com
What to watch next
The single most mechanical thing on the chart is the 1H trend line at $105.57. While 1H candles keep closing below it, the indicator's trend filter stays DOWN and the strategy continues to operate on the short side. If a 1H candle closed above $105.57, that filter would flip to UP, and the long/short markers the indicator prints would change accordingly.
Between current price and that line sit two reference points: the 24h high at $103.16 and the 7-day high at $105.22. A recovery that clears both would place price directly under the trend line; without that, the filter condition simply is not met. On the other side, $94.81 is both the 24h low and the 7-day low — if price trades below it, the chart would be making a new weekly low, and any further pullback or partial-exit markers would be printed by the indicator at the moment its fixed conditions are met, not before.
The indicator's position state remains short since Oct 8, with the last add-on marker near $104.34. Nothing new has printed since. Showing the indicator works on TradingView's free plan; creating alerts from it requires a paid TradingView plan (Essential or higher).